Research Article
Design of Ultrasensitive Electrochemical Aptasensor for Earlier Detection of Hepatitis B Virus
Dheyaa Hussein Mohsin 1, 2 *, Muthana Saleh Mashkour 3, Fataneh Fatemi 4, Emad Salaam Abood 5
1 Chemistry Department, College of Science, University of Kufa, Iraq.
2 General Directorate for Education in Najaf, Ministry of Education, Iraq.
3 Chemistry Department, College of Science, University of Kufa, Iraq.
4 Shahid Beheshti University G.C, Protein Research Center, Tehran, Iran.
5 Medical Physics, Hilla University College, Babylon, Iraq.
* Corresponding authors. E-mail: dheyaa.h.mohsin@gmail.com
Received: Sep. 17, 2020; Accepted: Jan. 28, 2021; Published: Apr. 29, 2021
Citation: Dheyaa Hussein Mohsin, Muthana Saleh Mashkour, Fataneh Fatemi, and Emad Salaam Abood, Design of Ultrasensitive Electrochemical Aptasensor for Earlier Detection of Hepatitis B Virus. Nano Biomed. Eng., 2021, 13(2): 150-164.
DOI: 10.5101/nbe.v13i2.p150-164.
Abstract
In consideration of the imperious need for developing a simple, ultra-sensitive and selective method to detect Hepatitis B virus (HBV), an label free aptasensor was constructed by the modification of a chemically inert glassy carbon electrode (GCE) by dint of a gold nanoparticle immobilized reduced graphene oxide. The ultrasensitive detection was attained using a specific ssDNA (thiolated aptamer at the 5′ end) as a recognition element. The aptamer was fastened onto GCE/rGO/Au surface via the Au-S bond for determining the impedance of charge mobility by means of [Fe(CN)6]3-/4- as a redox gauge. The function of aptasensor based on the specific interaction between the aptamer and specific surface antigen HBsAg induced [HBsAg-aptamer] complex formation which impeded electron movability between a [Fe(CN)6]3-/4- redox probe solution and sensing interface. HBsAg-binding aptamer events can be easily monitored by the signal switch through cyclic voltammetry technique (CV), square wave voltammetry (SWV), and electrochemical impedance spectroscopy (EIS) measurements. Under the optimized conditions, the aptasensor can detect HBsAg in the 0.25 fg/mL to 1.5 fg/mL concentration range and limit of detection of 0.018, 0.0016 and 0.001fg/mL for CV, SWV and EIS respectively. The recovery of 88 - 109.6% was obtained. Moreover, the selectivity of the aptasensor was tested using other biological interfering substances. This developed aptasensor provided one of the lowest limits of detection for HBsAg recently reported in the literature, satisfying stability and good reproducibility, consequently could be applied for revealing HBsAg in real samples.
Keywords: Hepatitis B virus, Electrochemical aptasensor, Voltammetry, Electrochemical impedance spectroscopy, Aptamer, Graphene oxide.
Introduction
Hepatitis B virus (HBV) be regarded as serious health issue and famous leading causes for a remarkable portion of sickness and mortality worldwide [1, 2]. Wide spectrum of liver problems including chronic hepatitis, liver cirrhosis, hepatic failure, and hepatocellular carcinoma, especially in developing high populous countries [3,4]. 90% of people who acquire acute HBV infection as infants will get chronic HBV infection as adults [5]. An estimate of around 2 billion people are serological evidence carrier of recent or preceding infection with HBV in the world [6]. Notwithstanding the introduction of an inoffensive and effective vaccine for neonates, 5.2 million cases of acute infection were identified in the year 2000. The current estimates presence over 400 million individuals with chronic infection of hepatitis B virus (HBV) [7, 8]. Viral hepatitis ranked in the top health concern and remains as an international public health challenge compares with other major life-threatening diseases; HBV was the tenth highest cause of death, approximately 786 000 deaths per year [9, 10]. Three major modes for HBV transmission, HBV is transmitted to neonates by their infected mothers, by unsafe contact with infected blood or with contaminated instruments, and the most common routes for transmission are through unprotected sexual contact with an infected person [11, 12]. One of the most important and crucial steps to take for the control of various types of HBV infection is the early and precise diagnosis of those malignant diseases. HBV is characterized by being enveloped in the shape small in size with an in-part double-stranded DNA genome virus [13]. Several serological markers for HBV infection include HBV DNA, hepatitis B surface antibody (HBsAb), hepatitis B e antibody (HBeAb), hepatitis B e antigen (HBeAg), hepatitis B core antibody (HBcAb), and hepatitis B surface antigen (HBsAg). Among these markers, HBsAg is the most important and hallmark of infection, HBsAg is the first to appear in the circulation of people who have acquired HBV infection. particularly, HBsAg detection is a significant tool for diagnosing an HBV infection and it is level quantification is necessary to predict patients response to interferon ,the progress of disease and treatment influence in health recovery [14-16]. HBsAg can be detected with a reliable method before the progression of HBV infection and typically as early as 6-8 weeks after the infection. There is an imperious demand for developing more rapid, sensitive, selective and cost affordable point-of-care assays, especially in weaker health-care infrastructure resource-limited settings to shorten the period between the infection and the detection of infection markers. This current challenge is a particularly crucial point for preventing the transmission of infectious hepatitis B virus and monitor this type of viral infection in the early phases of its evolution for well improving the standards of living [17-19]. Immunoassays that rely on two-site antibody-antigen interactions have been evolved for the detection of HBsAg in human serum specimens [20, 21]. These immunogenic assays involve electrochemistry immunoassay, enzyme linked immunosorbent assay (ELISA), radioimmunoassay (RIA), quartz crystal microbalance (QCM) immunoassay[22], impedimetric immunoassay [23], and chemiluminescence immunoassay [24]; however, using these detection strategies is severely hampers clinical detection as it requires highly trained personnel and has variability in interpreting the results, complex to perform, time-consuming, sophisticated instrumentation, and unsatisfactory for testing the ultralow concentration of biomarkers in some diseases early stages [25-28]. Furthermore, the use of antibodies in such immunoassays as yet still the major obstacle. Therefore, Due to the inadequacy of the above-mentioned methods, it is important to developing a new highly sensitive, easy-to-perform, cost-effective assays for daily screening of HBV infection, especially in underdeveloped areas. Aptamers are usually artificial short RNA or single-stranded DNA can be selected in vivo using the SELEX procedure (systematic enrichment of ligands by exponential amplification) which involves the screening of a large combinatorial library of nucleic acids by iterative rounds of binding, partition, and amplification [29]. Aptamers exhibit special ability to fold into unique three-dimensional conformation for attaching their cognate target using high affinity and specificity by conformational recognition similar to that mediated antibody-antigen recognition [30]. Due to their factional similarity to antibody, aptamers have been successfully developed against a diverse target, including ions, drugs, peptides, proteins, toxins, and even cells or tissue [31, 32]. Compared to the antibody, aptamers offer many advantages such as being smaller in size, cost-effective, easily produced and characterized. Furthermore, aptamers are more thermal stability, have lower immunogenicity, lower toxicity and simple to chemically modify[33]. Aptasensors are types of affinity-based biosensors that us make use of aptamers as detection elements depending on the specificity of aptamers towards their targets [34]. Electrochemical aptasensor have gained much interest in biomarker detection due to their advantages such as fast and more sensitive response with using low amounts of aptamers, miniaturization, and simple operation [32, 35, 36]. Electrochemical aptasensors detect the desired target based on the change in response as a result of interaction between the target and the aptamer functionalized electrode surface [37]. Most of the exciting merits of integral aptamers in electrochemical sensors are the ability of aptamers to be denatured and re-natured several times while preserving high binding affinity to their targets [38]. Also, the aptamer can be easily modified with anchoring functional groups for immobilization to solid supports and simple labeling with redox-active components which convert molecular interactions between the aptamer and it is target into measurable electrical signals [39]. Recently, the use of nanostructure surface and nanoparticles such as nanospheres, nonporous, nanotubes and nanowires have been used for constructing electrochemical sensing platform to upgrade the sensitivity of the electrochemical type sensor [40, 41]. The use of graphene dramatically improved the sensitivity of electrochemical signal of various electrodes owing to their intrinsic mechanical and electrical merits such as high large specific active surface area, wide potential window, high electronic conductivity, a high electrocatalytic activity, low cost and a numerous of chemically reactive groups decorated on the graphene surface [42, 43]. However, some certain restrictions are correlated with the use of graphene alone including irreversible hydrophobic self-agglomerations of graphene nanosheets as a result of π stacking interactions, poor reliability/repeatability, low colloidal stability, and non-specificity [44, 45]. Gold nanostructures (AuNPs) can be dispersed on graphene sheets to produces the graphene-AuNPs hybrid nanocomposite which minimizes the restrictions as well as providing outstanding synergistic properties, that is, AuNPs can protect rGO against the agglomeration, enhancement electrical conductivity, improve catalytic activity, water solubility, lowering the limit of detection at the nanoscale, lack of toxicity and biocompatibility [46, 47]. Electrochemical aptasensor for detection Hepatitis b virus surface antigen without any additional signal amplification strategy was fabricated using reduced graphene oxide–gold nanostructures. To design an aptasensor, rGO-Au-Apts have been coated on the GCE electrode surface and then were used to detect HBsAg. All construction steps of the proposed aptasensor, as well as its analytical performance toward the HBsAg, were investigated using CV, SWV and EIS. This developed aptasensor exhibits higher sensitivity, applicable stability, agreed reproducibility, and provided one of the lowest limits of detection for HBsAg by recently reported methods, which also might be applied for detecting HBsAg in spiked human specimens and could make possible the diagnosis of HBsAg as low as sub femtogram per mL scales.
Experiment
Chemicals and materials
All the chemical materials used in this work, obtained from. Sigma-Aldrich (USA), with the analytical grade and used without further purification. Graphite powder with size of particle < 20 µm 99.99 wt % , potassium permanganate (99%), sodium nitrate (98%), sodium hydroxide (97%), hydrogen peroxide (30% wt), sulphuric acid (98%), hydrochloric acid (35%), potassium chloride (99%), potassium hexacyanoferrate K4[Fe(CN)6] and K3[Fe(CN)6] (99.5%), ethanol (99.5%), ammonia solution, hydrogen tetrachloroaurate (III) (HAuCl4⋅3H2O, 99.99%), antigen (HBsAg) was acquired from Abcam. ssDNA aptamer targeting HBsAg from previous work was synthesized by Bio basic Canada INC [48]. The HPLC purified aptamer was modified by thiol group through a C6-carbon spacer arm at the 5’-end, of which sequence is 5- -SH-(CH2)6- GGG AAT TCG AGCTCG GTA CCG GCA CAA GCA TAT GGA CTC CTC TGA ACC TAC GAT GTA GTA CCTGCA GGC ATG CAA GCT TGG-3′. The dilution processes of lyophilized aptamer powder and HBsAg were realized with phosphate buffered saline (PBS, pH 7.4) containing 137 mM NaCl, 2.7 mM KCl, 1.8 mM KH2PO4 and 10 mM Na2HPO4..The aptamer and HBsAg solutions were made at definite concentrations and kept frozen at -20°C until use. All solutions prepared with deionized water (DI) purified by a MilliQ system (Millipore, Molsheim, France) used throughout the experiments.
Instruments
All electrochemical investigates were performed by using IVIUMSTAT.XR (Electrochemical Interface & Impedance Analyzer) at room temperature with a usual standard three-electrode configuration. A platinum wire was employed as the auxiliary electrode, an Ag/AgCl reference electrode (3 M KCl), and modified glassy carbon electrode (GCE, 2 mm in diameter) was used as the working electrode in a 20 mL voltammetry cell from Azar Electrode Co. After each step, the working electrode was rinsed with PBS. Nanocomposites characterized by the Fourier transform infrared (FTIR) was recorded using a Spectrum RX I (PerkinElmer). X- ray diffraction (XRD, PANalytical, X’Pert High Score diffractometer with high intensity CuKα radiation (λ = 0.15406 nm) was achieved using Cu Kα radiation source. transmission electron microscopy (Philips EM208 TEM). An ALPHA 1-4 LDplus from Martin Christ, Germany was used for accomplishing lyophilization process. For centrifugation processes, a Sigma 4 K15 centrifuge, Sigma Laborzentrifugen GmbH, Germany was used with probe ultrasonic (Hielscher up 200 h).
Preparation of graphene oxide GO
Graphene oxide GO was freshly prepared by means of a Hummer’s protocol [49, 50] through liquid oxidization. The GO synthesis procedure is described as follows: 23 mL of concentrated (H2SO4) was placed inside round-bottom flask in an ice-bath to control the operating temperature at (0-6 ºC). A mixture of graphite (1g), sodium nitrate (0.50 g) was dispersed in (H2SO4) solution with continuous stirring for 20 min to get a well-mixed homogeneous suspension. Afterward, (KMnO4, 3g) as an oxidation agent added slowly in a very small amount to the suspension to avoid robust reaction at limited district, the suspension color was converted to green sludge, meanwhile, the reaction mixture was maintained at lower than 15 ºC for 2 h. Later, the temperature of reaction was slowly elevated to 35 ºC and retained the other half hour with stirring. Then, 50 mL of DI was added in dropwise to the suspension. The reaction was heated to 98 ºC for half hour with stirring. Then, 140 mL of DI was added. After 10 min, 30% wt 35 mL H2O2 was poured inside the reaction container to terminate the reaction. Then, the reaction was kept at 57 ºC overnight. The resulting brown /yellowish color product was isolated from solution by centrifugation (5,000 rpm, 10 min). The resulting graphene oxide (GO) was washed-centrifuged 3 times with 0.1 M HCl solution and warm (70 ºC DI) to remove impurities, the acid residue and Mn ions. The supernatant was decanted after centrifugation, and later the remaining graphene oxide as a moist particulate was freeze-dried to prevent coagulation of the particles. Finally, the graphene oxide (GO) was obtained as a solid powder.
Reduced graphene oxide (rGO) preparation
600 mL GO suspension with 1 mg/mL concentration in DI was prepared via 30 min sonication of GO. As a result, homogeneous GO suspension with brown color was obtained. NH3.H2O solution was used to adjust the pH of the suspension up to 10. 6.00 mL of 32.1 mmol hydrazine hydrate of was gradually dropped to the GO suspension. The temperature of the mixture was raised up to 100 ºC with continuous reflux system for 24 h; meanwhile the rGO gradually deposited out as solid. The rGO was centrifugally separated from solution at 5,000 rpm for 10 min. The resulting rGO powder was centrifuged, washed by ethanol (70%) and deionized water for five times The supernatant was decanted after centrifugation, and the resulting moist particulate of reduced graphene oxide was freeze-dried to obtain solid powder [51, 52].
Preparation of reduced graphene oxide-gold NPs (rGO/Au)
80 mL rGO suspension with 5.0 mg/mL concentration was prepared using the same way mentioned for preparing the GO suspension. Then, 2 mL 0.25 M hydrogen tetrachloroaurate (III) (HAuCl4⋅3H2O) solution was gradually added to the suspension in dropwise with stirring. The reaction mixture was kept under continuous stirring at room temperature for 4 h. After that, reduced graphene oxide–gold NPs was centrifuged-washed twice with DI and ethanol and dried with vacuum lyophilization treatment [53].
Preparation of reduced graphene oxide-gold NPs-aptamer (rGO/Au/apt)
The thiol terminated aptamer was immobilized on the reduced graphene oxide-gold NPs, through the strong affinity of 5' end thiol groups of the aptamer (apt) with gold NPs decorated on reduced graphene oxide. First, 98 µL of reduced graphene oxide-NPs (rGO/Au) at the concentration of 6 mg/mL was placed into autoclaved mini Eppendorf tube, then was mixed with 2 µL of aptamer solution with concentration of 100 µM, the suspension was incubated in the refrigerator at 4° C for 24 h.
Electrode modification and HBsAg aptasensor fabrication
Summary of the aptasensor assembly is presented in Fig. 1. Generally, the glassy carbon (GCE) working electrode with the diameter of 2 mm was varnished carefully with alumina powder of 0.3 µm and 0.05 µm particle sizes placed on a microfiber textile until a mirror like surface was attained. Thereafter, the polished surface was quite washed with DI and sonicated sequentially absolute ethanol and DI. Cyclic voltammetry was performed to ensure the electrode surface was clean. Afterward, 2 µL of 0.1% wt Nafion solution was incubated with 18 µL of the rGO/Au/apt mixture for 15 min at room temperature. Nafion was used to support aptamer transductor attachment, and to displace nonspecific binding of target by blocking the free active sites and alignment of the aptamer monolayer. As well as passivation, the transductor surface with Nafion allows to reduce interactions between the decorated gold nanoparticles on the surface and chemical groups belonging to the oligonucleotide units other than the ssDNA-thiol group. Finally, 4 µL of the resulting rGO/Au/apt/Naf was casted onto a freshly smoothed GCE surface. GCE/rGO/Au/apt/Naf electrode was dried under lamp radiation for about 30 min. Subsequently, unbounded rGO/Au/apt/Naf was removed by careful washing of the electrode surface with 10 mM PBS (pH = 7.4). The electrode was stored at 4 ºC in PBS (pH = 7.4) when it was not used.
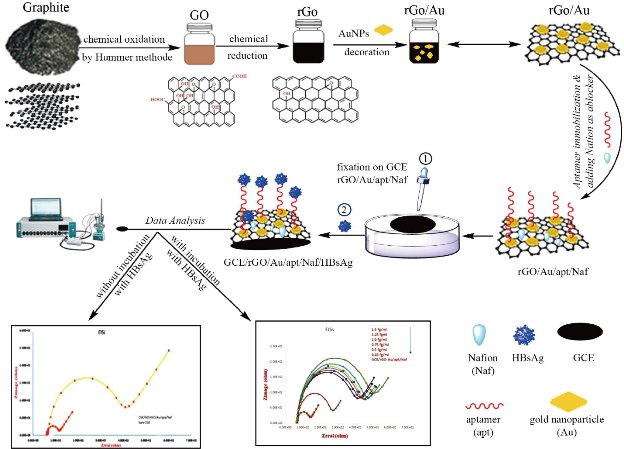
Fig. 1 The assembly process of aptasensor.
Experimental measurements and HBsAg sensitivity evaluation
All electrochemical investigates were accomplished at room temperature using 5 mM of the [Fe(CN)6]-3/-4 (1/1) solution prepared 0.1 M KCl. CV, SWV and EIS measurements were realized in [Fe(CN)6] -4/-3 as a redox probe solution because it provided easy electron transfer over the electroactive species on the modified electrode surface and it was more sensitive to surface modifications. CV was reported from -0.5 to 0.7 V, scan rate of 50 mV/s). SWV analysis was employed in the potential range from -0.5 to 1.0 V with pulse amplitude of 10.0 mV, and step potential of 10.0 mV with a frequency of 5 Hz. EIS was performed at 32 frequency points in the 0.1 Hz to100 kHz frequency range with perturbation amplitude of 5 mV at the potential of the anodic peak current of voltammogram curves. After the aptasensor was successfully fabricated, completely optimized and characterized, the surface of the assembled aptasensor was utilized to interact with the HBsAg solution. For each time measurement, 10 µL of HBsAg standard solution of various concentrations were sequentially incubated with sensing platform. After 45 min incubation period at room temperature, a humid condition to allow the specific connection events between aptamer and HBsAg to take place, the aptasensor was gently washed with 0.1 M PBS (pH = 7.4) to remove nonspecifically adsorbed of HBsAg. Finally, the obtained aptasensor was again immersed into the electrochemical cell containing the redox probe solution and the electrochemical measurements were carried out as above mentioned. All the experiments were repeated triplicate at minimum.
HBsAg specificity assessment and spiked samples analysis
The selectivity of the HBsAg aptasensor was investigated by SWV with 100 ng/mL bovine serum albumin (BSA), prostate-specific antigen (PSA), glucose and fetal bovine serum separately in solution (45 min incubation at room temperature in a humid environment). To check the analytical possibility of the developed aptasensor for the sensing and accurate level determination of HBsAg in spiked specimen. Solutions with different concentrations of HBsAg were prepared in diluted human serum solution (10:100 dilution with 200 mM, pH 7.4 PBS solution). Afterward, 10% human serum solutions were spiked with the required volume of HBsAg stock solution to obtain the desired concentration. Volumes of 10 µL of HBsAg solution were placed onto the sensing electrode and clutched for 45 min in a humid environment at room temperature, then carefully rinsed with PBS, and the peak current response was measured by SWV under optimal experimental conditions using 5 mM [Fe(CN)6]-3/-4 (1/1) solution prepared 0.1 M KCl.
Results and Discussions
Identification of GO, rGO and rGO/Au nanocomposite
FTIR was used for chemical structure identification of graphite, GO, rGO and rGO integrated AuNPs powders and to confirm the change in functional groups during each step. The recorded FTIR spectra in Fig. 2-Graphite showed that graphite powder has no strong characteristic absorption peaks due to the fact it has no functional groups, while a lot of carbon-oxygen functional categories such as C–OH, OH, C=O, and C–O were established successfully onto the surface of graphite after oxidation process. Fig. 2-GO showed strong characteristic absorption peak at 3415 cm-1 which corresponds to OH stretch, a broad peak at 1742 cm-1 corresponding to C=O stretching vibrations in carboxylic and carbonyl moieties, the evident peak at 1619 cm-1 marking the presence of the C=C groups vibration in aromatic rings, 1222 cm-1 assigned to the epoxy C-O groups vibration, and the peak around 1049 cm-1 assigned to C-O alkoxy groups [54, 55]. Finally, the peak at 985 cm-1 is assigned to vibrations of either peroxide or epoxy group [56]. Moreover, the existence of these carbon-oxygen categories indicates that the graphite has strongly exfoliated and oxidized well to graphene oxide sheet, also it can be deduced that the GO has strong hydrophilicity. For the reduced graphene oxide Fig. 2-rGO, the bands intensities associated to carbon-oxygen functional categories significantly decline in comparison with bands intensities of GO. However, the bands intensities decline appears to be noteworthy for OH groups. Regarding the characteristic peak at 3415 cm-1 , the decrease in band intensities specified that a significant amount of carbon-oxygen functional categories were removed by chemical reduction using hydrazine hydrate producing electrically conductive reduced graphene oxide. It is noted from the spectra of rGO that the entire carbon-oxygen moieties were not totally removed as absorption peaks at 1719 cm-1 corresponded to the C=O stretching. It is believed that the presence of some of the carbon-oxygen moieties can facilitate the reduction of Au3+ by acting as electrons donor [57]. The appearance of strong characteristic absorption peaks (Fig. 2-rGO-Au), following immobilization AuNPs on rGO indicated that rGO was significantly decorated by AuNPs. The crystal structure and the interlayer distances of GO, rGO, and rGO/AuNPs nanocomposite were characterized using X-ray diffraction (XRD). The XRD crystallographic patterns are illustrated in Fig. 3. Graphite powder exhibited characteristic diffraction peak at 2θ = 26.6 ascribing to (002) crystallographic plane with a relative interlayer distance of 0.34 nm based on Bragg’s equation [58]. After chemical oxidation, the diffraction peak shifted to a lower value at 2θ =10.8° due to (001) crystallographic plane, which indicates a relative interlayer distance of 8.185 nm. This peak transformation revealed that the graphite was oxidized well into GO powder, This widening of the relative interlayer distance can be attributed to the intercalation of water molecules and generation a lot of carbon-oxygen moiety such as C–O, C=O, O–H, C–OH, and groups between the inter-layering of the stacked graphite sheet during consecutive oxidation [59]. Furthermore, the diffraction peak appeared at 2θ = 44.8° associated with (100) graphite plane confirms that a little bit of graphite are still present [60]. rGO exhibits diffraction peak at 2θ = 26° equivalent to 002 plane with a d-spacing of 3.36 nm, similar to the XRD peak (2θ = 26.7°) of the starting graphite material. The interlayer distance decrease due to the removal many of oxygen atoms, The result suggests that the GO was readily reduced successfully into rGO [55]. The XRD crystallographic pattern of the rGO/Au nanocomposite were exhibited bands at 2θ values of around 38.20°, 44.41°, 64.59°, and 77.58°, corresponding to the (111), (200), (220), and (311) crystallographic planes of cubic structure of AuNPs [61]. It has been reported that the gold nanoparticles immobilized on rGO surface. Distribution of AuNPs on rGO surface and morphology of the rGO/AuNPs surface was investigated by TEM analysis. In Fig. 4(a)) and (b), AuNPs showed a homogeneous distribution and nearly completely covering the surface of rGO without any free particles outside the sheets, indicating the composite formation of rGO/AuNPs, with the average size of the immobilized AuNPs was obtained to be in range of 50-100 nm. Moreover, TEM image of rGO and rGO/AuNPs showed high-quality two-dimensional single-atom-thick appearance of the typical wrinkled and occasional folds graphene nano sheet structure, and the transparent property associated with them.
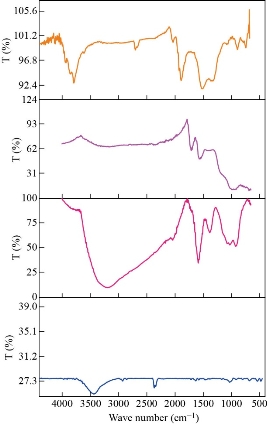
Fig. 2 FTIR spectra of graphite GO, rGO and rGO-Au powders.
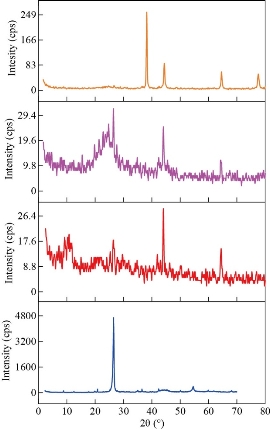
Fig. 3 XRD spectra of graphite, GO, rGO and rGO-Au powders.
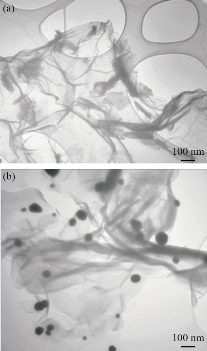
Fig. 4 (a) TEM images of rGO and (b) rGO-AuNPs.
Electrochemical behavior of the HBsAg aptasensor
The fabrication processes of the reconstructed electrode were verified by means of employing CV, SWV and EIS techniques for recording the interfacial alterations at electrode surface during consecutive layer-by-layer modification processes of electrode to approve that the electrochemical aptasensor was constructed efficaciously. Firstly, the electrochemical properties of the bare GCE, GCE/GO, GCE/GO/rGO, GCE/GO/rGO/Au, GCE/GO/rGO/Au/apt, GCE/GO/rGO/Au-apt/Naf and GCE/GO/rGO/Au/apt/Naf/HBsAg were investigated using CV (scan rate 50 mV/s), and the corresponding voltammogram is recorded in Fig. 5(a). As can be seen, at the bare GCE electrode (voltammogram a), [Fe(CN)6]3-/4- redox probe exhibits a perfectly-defined reversible reduction/oxidation behavior with the largest observed anodic and cathodic peak current related to a large exchange electron between the redox probe and electrode surface. GCE surface coating with GO (curve b) leads to dramatically decrease in the capacity of anodic and cathodic currents. Compared to the peak currents of the bare GCE (curve a) which indicates the slow redox reaction of Fe3+/2+at the interface due to completely covering of the bare electrode by low conductivity, GO thin film with significant amount of negatively charged carbon-oxygen functional groups on its surface which can repels [Fe(CN)6]3-/4- ions bearing negative charge and deaccelerate the diffusion process of redox probe to the GCE surface [62]. Compared to curve b, an obvious expansion in the capacity of the anodic and cathodic currents was observed when the rGO was casted on GCE/GO (curve c) due to its good conductivity and large active surface area of rGO. After decoration of GCE/GO/rGO surface with AuNPs’ significant rise in capacity of the peak current was observed (curve d). These increase in peak currents due to outstanding electrical conductivity of AuNPs and expanding electrochemical active surface area of the electrode by nanocomposite which facilitates diffusion process of redox probe to the electrode surface and accelerate electron exchange rate. Otherwise, upon immobilization of the aptamer, the peak currents decrease significantly with a small shift in the formal potential magnitude toward positive value, which is due to the change in the morphology of the electrode surface after SH-aptamer was covalently immobilized on AuNPs. The redox probe should penetrate the electrode surface covered by self-assembled monolayer (SAM) of the aptamer. The negatively charge phosphate groups of the aptamer molecules causes a physical repulsion to probe anions that certainly limits this access of the redox probe to the electrode surface which results in decreases in the quantity of redox current (curve e). Afterwards, the redox peak current decreased when the electrode surface was treated with Nafion due to blocking effect which results in diminishing of obtainable free active sites for electron transfer between the redox probe and the electrode (curve f). As well as the electrostatic repulsion force resulting from sulfonate groups, the bearing negative charge belonged to Nafion skeleton which repulsed [Fe(CN)6]3-/4- anions [63]. Furthermore, Nafion molecules cause an insulation layer located at the interface separates electrode from electrolyte which further delays the diffusion process of the redox probe into electrode surface thus producing a lower current. Incubation the aptasensor with HBsAg causes to dramatically decrement in the current response (curve g) which ascribed to the physical obstacle to the diffusion of redox probe generated by extra insulator layer of the produced aptamer- HBsAg complex at the electrode /electrolyte interface. These findings confirm the successful fabrication of aptasensor with above-mentioned strategy. SWV estimations were also conducted to characterize the preparation stages of the electrochemical aptasensor; the obtained results are given in Fig. 5(b). The SWV results have excellent harmony with the former outcomes obtained from CV analysis. EIS is a powerful tool for exploring electrode surface change and has been considered as highly suitable strategy for and sensitive swift detection bioanalysis [64]. The typical EIS experiments were performed for observing the interfacial properties variation occur during electrode fabrication process. The Nyquist plots for different modified electrodes are illustrated in Fig. 5(c). The information obtained from EIS analysis was matched with a Randles circuit, as explained in the inset of Fig. 5(c). RS indicates the resistance probe solution. Rct refers to charge-transfer resistance which is direct measurement for blocking behavior of the electrode interface, while Cdl represents the capacitance of double layer. Finally, Zw equivalent Warburg impedance which displays diffusion behavior of the electro active reactants. As can be seen, all the diagrams have similar features, each diagram has a semicircle domain at elevated frequencies that related to the charge-transfer limiting step of the Fe2+/Fe3+ electrochemical reaction taking place on interface layer at the electrode surface, The greater semicircle diameter indicates the greater charge transfer resistance, and an almost straight line domain at low frequencies indicates the diffusion-limited process, and so the smallest semicircle diameter with the Rct value of 88.3 Ω (brown curve) for bare GCE confirms the higher charge transfer. The semicircle diameter dramatically increased with the Rct value of 206 Ω (blue curve) when GCE was coated by GO nanosheet due to electrostatic repletion between negatively charged carbon-oxygen functional groups of the GO sheet surface and [Fe(CN)6]-3/4- anions of probe solution which enhance the electron transfer resistance. An additional decreasing in semicircle diameter with Rct value of 191 Ω when electrode surface coated by rGO nanosheet (purple curve), while a notable reduction of the semicircle diameter and Rct was found to be 107 Ω (light blue curve) when rGO/Au nanocomposite layer were coated on the electrode surface as rGO/Au nanocomposite exhibited high conductivity facilitating the electron transfer between [Fe(CN)6]4-/3- and the electrode. Upon assembly of aptamer layer on the electrode surface, the semicircle diameter remarkably increased Rct was found to be 264 Ω (orange curve). This impedance increases owing to the negatively charges phosphate groups in the aptamer molecules producing electrostatic repletion force to [Fe(CN)6]4-/3- which obstructed electron transfer. Another increase in semicircle diameter was observed when Nafion was used to coat uncovered sites onto the electrode surface. This increase in Rct value of 291 Ω (green curve) is related to the decrease of accessible sites for electron exchange reaction as well as due to electrostatic repletion force between sulfonate groups of Nafion molecules and redox probe. The highest increase in semicircle diameter with Rct value of 340 Ω (black curve) was observed after incubation of the aptasensor with HBsAg, when aptamer and HBsAg are bound to each other and [HBsAg- aptamer] complex is formed and the electrode surface is covered with insulating layer which hindered the access of the redox probes into electrode surface to a higher point compared with the situation of HBsAg absence. Consequently, the Faradic reaction of a redox components inhibits progressively result in an increase in the impedance of the electron transfer. Findings of EIS measurements in agreement with pervious results attained by CV and SWV and confirm that the electrochemical aptasensor was assembled.
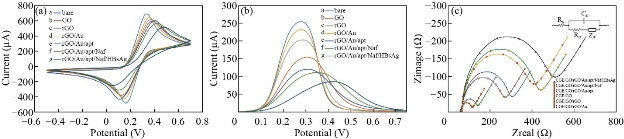
Fig 5 Electrochemical characterization of (a) aptasensor CV curves of the bare and different modified GCE, (b) aptasensor SWV curves of the bare and different modified GCE, and (c) EIS curves of the bare and different modified GCE in 5 mM of [Fe(CN)6]4-/3- (1/1) prepared in 0.1 M KCl.
Optimization of experimental conditions
The experimental conditions affect the electrochemical signal of aptasensor including concentration of rGO/Au. Functionalization time of the rGO/Au/apta/Naf probe on the electrode surface and HBsAg incubation time with aptasensor were investigated under a predetermined experimental condition with aptamer concentration of 100 µM HBsAg at the concentration of 0.75 fg/mL and pH = 7.40 at room temperature to obtain repeatable, reproducible and high response aptasensor. It is worth noting that pH = 7.40 was chosen due to several reasons, such as it is equivalent to human blood pH, as HBsAg is biomarker protein and highly acidic or alkaline circumstance may cause protein denaturation [65] and to avoid conformational change in the three-dimensional structure of aptamer. On the other hand, potassium ferricyanide liberates highly toxic hydrogen cyanide gas under strongly acidic conditions [66]. The concentration of rGO/Au plays a significant role in aptamer immobilizing. To evaluate the effect of rGO/Au concentration on the current response of the designed aptasensor, various rGO/Au concentrations of 2, 4, 6, 8 and 10 mg/mL range were cast on the electrode surface. The Rct values plot vs. rGO/Au (Fig 6(a)) show that the Rct declined with the increase of the rGO/Au concentration down to a minimum value at 6 mg/mL and remained constant for the rest of the concentrations. On the other hand, Rct value of 6 mg/mL concentration was close to the Rct value of the bare electrode. Functionalization time of the rGO/Au/apta/Naf probe on the electrode surface was the second optimization step. Various functionalization time of 10, 20, 30, 40 and 50 min was investigated to obtain Rct values against their time, as plotted in Fig. 6(b). The results indicated that optimal time for functionalization was 30 min; a shorter period could not allow the formation of a stable layer of rGO/Au/apta/Naf probe that tightly adhered the glassy carbon electrode surface, while 30 min period was enough, and there was no significant effect for a longer period. The fluence of incubation time of aptasensor with HBsAg was investigated in the range of 15, 30, 45, 60 and 75 min. The results presented in Fig. 6(c) indicate that the Rct increased with the increasing of incubation time up to the maximum value at 45 min, and then remained constant for the rest incubation time. Thus, 45 min was selected for the aptamer-HBsAg binding reaction.
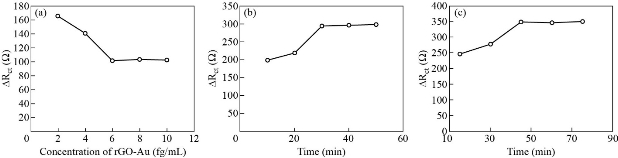
Fig. 6 The influence of (a) rGO/Au concentration, (b) functionalization time of the rGO/Au/apta/Naf probe, and (c) incubation time of aptasensor with HBsAg.
HBsAg detection
Under optimal experimental conditions, CV and SWV experiments were employed to estimate the analytical performance of aptasensor by detecting HBsAg at various concentrations. To obtain HBsAg calibration curves, the change peak current values (ΔI = I Nafion – I HBsAg) were utilized, where I Nafion was the peak current value of both CV and SWV responses after blocking nonspecific binding sites with Nafion, whereas I HBsAg was the peak current value after HBsAg captured by immobilized aptamer on the developed aptasensor. The limit of detection (LOD) and limit of quantification (LOQ) of present aptasensor were evaluated based on the 3SD/SC and 10SD/ SC criterion respectively, where SD was the standard deviation of the blank and SC was the slope of the calibration plot [67]. The CV responses are presented in Fig. 7(a). It was revealed that the highest current response was conducted in the absence of the target, while the peak current decreased gradually with increasing the concentrations of HBsAg. Specific interaction of the aptamer with HBsAg stimulates conformational alteration in the aptamer. 3D structure becomes more compacted close to the electrode surface, producing an obstacle to the redox probe diffusion process into the electrode surface. Thus, the magnitude of the current response ascribing to Fe2+/Fe3+ reaction was decreased. A standard calibration curve for HBsAg was plotted in Fig. 7(b) by the help of the ∆I and HBsAg concentrations. ∆I exhibited a good linear detection relationship with HBsAg concentrations in the range of 0.25, 0.5, 0.75, 1.0, 1.25 and 1.5 fg/mL. The regression equation is I∆/(µA) = 1.1297[HBsAg] (fg/mL) + 0.0473 with a correction coefficient of 0.989. The LOD for HBsAg equivalent to 0.018 fg/mL and LOQ equivalent to 0.061 fg/mL. Fig. 7(c) depicts the SWV responses of the aptasensor induced by HBsAg at different concentrations in [Fe(CN)6]-3/-4 media. SWV responses decreased as HBsAg concentration increased. As can be seen in Fig. 7(d), the developed aptasensor exhibits a linear interrelation between ∆I and log [HBsAg] in the same range mentioned above. The regression equation was I∆/(µA) = 65.049 log [HBsAg] (fg/mL) + 85.606 with a correction coefficient of 0.989. The LOD for HBsAg equivalent to 0.0016 fg/mL and the LOQ value of 0.0056 fg/mL. EIS is a powerful technique to survey the performance of electrochemical biosensors. Fig. 7(e) depicts the Nyquist plots for different HBsAg concentrations. It was revealed that the diameter in the Nyquist plots increased with increasing HBsAg concentrations. The reason of this is due to formulation of mono layer of aptamer on electrode surface, in which each aptamer acted as long spacer arm with specific binding sites for targeting HBsAg molecules, leaving long channels that allow the redox indicator to reach electrode surface. In the present approach, aptamers collected together were acted as long channels gateways. In the absence of a target, the immobilized aptamer is thought to keep their structure relatively with a linear configuration, thus leaving the gate switch on for redox probe to reaches transducer surface, where the flow of electrons between transducer surface and redox probe was allowable. However, the addition of HBsAg molecules switches off the gates by conformational changes of the aptamer structure to highly compacted structure that locked the entrance of channels, due to formation [aptamer-HBsAg] complex resulting in decrease in the flow of electrons between transducer surface and redox probe. The rising HBsAg concentrations increased the amount of [aptamer-HBsAg] complex and subsequently reduced the number of open channels, resulting in the increased charge transfer resistance. The calibration plot is presented in Fig. 7(f) by the help of the ∆Rct and HBsAg concentration, where ∆Rct is the difference in charge transfer resistance described as ΔRct = RctHBsAg – RctNafion where RctHBsAg and Rct Nafion are charge transfer resistance before and after incubation with HBsAg. ∆Rct exhibits a good linear detection relationship with HBsAg concentrations in the range of 0.25, 0.5, 0.75, 1.0, 1.25 and 1.5 fg/mL. The regression equation is ∆Rct(Ω) = 89.714[HBsAg] (fg/mL) +1.666 with a correction coefficient of 0.9818. The limit of detection for HBsAg equivalent to 0.001 fg/mL and a limit of quantitation (LOQ) equivalent to 0.0044 fg/L. Electrochemical response exhibited a good linear detection relationship with HBsAg concentrations in the range of 0.25, 0.5, 0.75, 1.0, 1.25 and 1.5 fg/mL. Comparison of the analytical performance of this work with other methods reported in the literature for determination HBsAg is presented in Table 1. To our knowledge, according to the data obtained, the present system exhibits a much lower limit of detection than those obtained from previously reported methods, with acceptable linear range for detection.
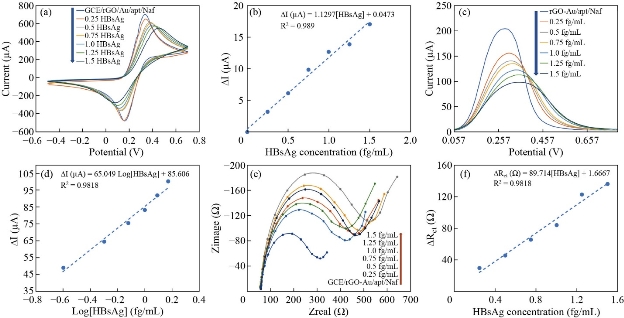
Fig. 7 (a) CVs, (b) SWVs and (c) EISs response of electrochemical aptasensor for determining HBsAg at different concentrations in 5 mM [Fe(CN)6]-4/-3 (1/1) solution prepared in 0.1 M KCl. (d), (e) and (f) Related calibration plots of CVs, SWVs and EISs measurements respectively.
Table 1 Comparison of different analytical methods for the detection of HBsAg
|
Methods |
Linear range |
Limit of detection |
References |
|
Label-free electrochemical immunoassay |
1 - 6 ng/mL |
0.03 ng/mL |
[68] |
|
Electrochemical impedance immunoassay |
0.1 - 70 ng/mL |
0.06 ng/mL |
[69] |
|
Surface plasmon resonance |
10 pg/mL - 1 μg/mL |
10 pg/mL |
[70] |
|
Dot-blot immunoassay |
0.133 - 2.5 ng/mL |
0.13 ng/mL |
[18] |
|
Chemiluminescent aptasensor |
1 - 225ng/mL |
0.05 ng/mL |
[17] |
|
Magnetic immunoassays |
0.26 pg/mL - 2.6 ng/mL |
0.25 pg/mL |
[71] |
|
ELISA |
1 - 40 ng/mL |
1.0 ng/mL |
[72] |
|
Sandwich-type electrochemical immunosensor |
0.001 - 20 ng/mL |
0.3 pg/mL |
[73] |
|
Immunochromatographic and electrochemical immune assay |
5 - 3000 ng/ mL |
2.1 ng/mL |
[74] |
|
Present work |
0.25 - 1.5 fg/mL |
0.001 fg/mL |
-- |
Selectivity, reproducibility, repeatability and stability of aptasensor
An ideal sensing system not only possesses a good sensitivity but also has an excellent selectivity. The selectivity of the aptasensor for detection HBsAg was tested in the presence of biological interfering substances, including bovine serum albumin (BSA), prostate-specific antigen (PSA), glucose, and fetal bovine serum with a concentration of 100 ng/mL. The changes in the SWV current response ∆I for the aptasensor towards 0.75 fg/mL and different interference substances are depicted in Fig. 8. The peak current of aptasensor after reaction with interfering substances characterized by a negligible decrease compared to the aptasensor response observed for HBsAg even though their concentrations were much higher than the concentration of HBsAg indicating that the designed aptasensor had excellent sensitivity and could meet the experimental requirements. Reproducibility, repeatability and stability are the most important parameters for designed aptasensor. To characterize reproducibility, five parallel prepared aptasensors under optimum conditions were used to detect HBsAg of 0.75 fg/mL concentration. The results revealed that the SWV curves were very similar to each other and obtained relative standard deviation (RSD) of deferent aptasensor was to be 5.66% demonstrate high reproducibility of the aptasensor for HBsAg detection. The repeatability of the developed aptasensor was evaluated by repeating the HBsAg detection experiment five times with the same aptasensor for the same concentration of HBsAg of 0.75 fg/mL, and the RSD was calculated to be 4.6% indicating the present aptasensor had good repeatability. The stability of the aptasensor was further examined After storage at 4 °C for two weeks, it was observed that of about 94.0% and 91.9% of initial peak current was remained after one and two weeks respectively when the aptasensor was used for detection of 0.75 fg/mL HBsAg. These results demonstrated that the stability of the aptasensor was acceptable. The feasibility and accuracy of the proposed electrochemical were then investigated by detecting HBsAg in human serum samples. For this purpose, standard HBsAg concentrations were spiked in 10% intact human serum solutions to get freshly HBsAg spiked samples with a concentration of 0.25, 0.5, 0.75, 1.0 and 1.25 fg/mL. The samples were detected by observing SWV current response changes (ΔI). It was observed from the results presented in Table 2 that the recoveries were ranging from 88% to 109.6% and the RSD varied from 3.2% to 6.4%, respectively. This result revealed that the aptasensor could be potentially applicable determining HBsAg in spiked samples.
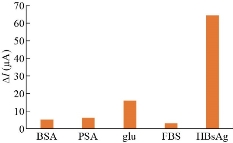
Fig. 8 Selectivity of developed aptasensor toward different biological interfering substances. The current responses induced by these interfering substances were negligible compared to the current response induced by HBsAg.
Table 2 Results of HBsAg detection in human serum using developed electrochemical aptasensor (n = 3)
|
Spiked HBsAg (fg/mL) |
Found HBsAg (fg/mL) |
Recovery (%) |
RSD (%) |
|
0.5 |
0.472 |
92.8 |
3.755 |
|
0.75 |
0.71 |
94.66 |
4.59 |
|
1.0 |
1.06 |
106.0 |
4.89 |
|
1.25 |
1.37 |
109.6 |
6.4 |
Conclusions
In summary, a simple, cost-effective and label-free electrochemical aptasensor for the detection of HBsAg was successfully developed based on rGO-Au NPs nanocomposite as an immobilization platform for ssDNA aptamer as the recognition element. The greatly enhanced sensitivity of the aptasensor relied on the synergistic effect of AuNPs with excellent conductivity and good biocompatibility, with high surface area and good electrical conductivity of reduced graphene oxide and aptamer with high affinity and specificity for capturing HBsAg. Under the optimized conditions, the developed electrochemical aptasensor detected HBsAg within the concentration ranged from 0.25 fg/mL to 1.5 fg/mL, with a detection limit of 0.018, 0.0016 and 0.001 fg/mL for CV, SWV and EIS respectively. The aptasensor exhibited high selectivity, good reproducibility and acceptable stability. The results of recovery measurements in spiked samples indicated that the practicability of developed aptasensor was acceptable. Due to previously mentioned merits, we recommend to use the present method as diagnosis tool for HBV infection.
Conflict of Interests
The authors declare that no competing interest exists.
References
Copyright© Dheyaa Hussein Mohsin, Muthana Saleh Mashkour, Fataneh Fatemi, and Emad Salaam Abood. This is an open-access article distributed under the terms of the Creative Commons Attribution License, which permits unrestricted use, distribution, and reproduction in any medium, provided the original author and source are credited.

|
Nano Biomedicine and Engineering. Copyright © Shanghai Jiao Tong University Press |
 |