Article
Realtime PCR based on Fluorescent Quenching of Mercaptoacetic Acid-Modified CdTe Quantum Dots for Ultrasensitive Specific Detection of Nucleic Acids
Daxiang Cui 1*, Qing Li 1, Peng Huang 1, Kan Wang 1, Yifei Kong 1, Hong Zhang 2 ,
Xiaogang You 1, Rong He 1, Hua Song 1, Jingping Wang 2, Chenchen Bao 1 , Toru Asahi 2,
Feng Gao 1,Tetsuya Osaka 2
1 Department of Bio-Nano Science and Engineering, National Key Laboratory of Micro/Nano Fabrication Technology, Thin Film Key Laboratory of Education Department, Institute of Micro-Nano Science and Technology, Shanghai JiaoTong University, 200030, Shanghai, P. R. China.
2 Consolidated Research Institute for Advanced Science and Medical Care, Waseda University, 513 Wasedatsurumaki-cho, Shinjuku-ku,Tokyo 162-0041, Japan.
* Corresponding authors. Email: dxcui@sjtu.edu.cn; daxiangcui@aoni.waseda.jp
Citation: D. Cui, et al., Realtime PCR Based on Fluorescent Quenching of Mercaptoacetic Acid-Modified CdTe Quantum Dots for Ultrasensitive Specific Detection of Nucleic Acids, Nano Biomed. Eng., 2010, 2(1): 45-55.
DOI: 10.5101/nbe.v2i1.p45-55
Abstract
A ultra-sensitive, highly specific, real-time polymerase chain reaction system based on mercaptoacetic acid-modified CdTe nanocrystals(mQDs) is reported. With the addition of 3 nm mQDs into the PCR reagent, the photoluminescent(PL) intensities of mQDs decreased gradually as the DNA templates and PCR cycles increased, in an approximate negative linear relation to the DNA concentration logarithm or cycles, the PL peaks exhibited red-shifts synchronously. Mg2+ ions decreased the PL intensity of mQDs in a dose-dependent means, and Taq DNA polymerase enhanced the PL intensity of mQDs in a dose-dependent means. Real-time PCR based on mQDs showed an increased sensitivity at least 103 fold higher than that based on SYBR Green I. The specificity of PCR was enhanced in the PCR reagent with less than 1.33mg/mL mQDs. The potential mechanism is also discussed. This novel PCR system based on mQDs has great potential in applications such as ultra-sensitive specific DNA or RNA detection, dynamic molecular imaging, and photoelectric biosensors.
Keywords: Mercaptoacetic acid-modified CdTe quantum dot; Polymerase chain reaction; Sensitivity; Photoluminescence; Specificity
1. Introduction
Quantum dots have been subject to intensive investigations because of their unique photo-luminescent properties and potential applications [1-3]. For example, quantum dots have been used successfully in cellular imaging [3-5], immunoassays [6], ultrasensitive DNA and antigen detection [7-8], and optical barcoding [9]. Quantum dots also have been used to study the interaction between protein molecules or detect the dynamic course of signal transduction in live cells by Fluorescence Resonance Energy Transfer(FRET) [10-11]. These synthesized quantum dots have significant advantages over traditional fluorescent dyes such as Cy3, Cy5, SYBR Green I and GFP, including better stability,stronger fluorescent intensity, and different colors adjusted by controlling the size of the dots [12-13]. Therefore, quantum dots provide a new functional platform for bioanalytical sciences and biomedical engineering. Polymerase chain reaction (PCR) is one high-efficient tool to obtain an abundance of DNA fragments exponentially within a short period of time [14]. For example, real-time quantitative reverse-transcription PCR [15], which can accurately quantify specific mRNAs in biological samples, has been broadly applied in fundamental research and genetic diagnosis [14-16]. However, the efficiency and yield of PCR are markedly affected by factors such as primers, template, Taq DNA polymerase, and the heating /cooling ratio of the PCR system [17]. To date, there have been some reports closely associated with the methods of improving PCR, including optimizing reaction condition, caring for primer design, adjusting concentration of Mg2+ ions, selecting high-quality Taq enzyme, using hot-start procedures, and using advanced PCR machines such as the capillary PCR machine [18]. The previous reports showed that single-walled carbon nanotubes can improve the efficiency and specificity of PCR [19-20], mercaptoacetic acid-modified CdTe uantum dots can improve the specificity of PCR [21]. However, the concrete mechanism is not still clarified well. Li, et al. also report that gold nanoparticles [22-23] can improve the efficiency or specificity of PCR and shorten reaction times, the excellent heat-transfer property of nanoparticles may be responsible for improving PCR efficiency [23-24]. However, so far few report is closely associated with the effects of quantum dots on real-time PCR. Here, we report a ultra-sensitive, highly specific, real-time polymerase chain reaction system based on mercaptoacetic acid-modified CdTe nanocrystals(mQDs) shown in Scheme 1. We selected mQDs and the BRCAA1 gene [25] as research targets, we investigated the effects of the components and cycles of PCR on the PL properties of mQDs, the effects of mQDs on the sensitivity and specificity of PCR, and the comparison between two quantitative PCR methods based on mQDs and SYBR Green I. Our results showed that mQDs can markedly enhance the sensitivity and specificity of PCR, a novel real-time PCR based on fluorescent quenching of mQDs was developed, and has potential in applications such as ultrasensitive specific pathogenic detection, dynamic molecular imaging, and photoelectric biosensors.
2. Materials and Methods
2.1 Materials
Ultrapure water(18 MΩ cm-1) was used to prepare all aqueous solutions. Cadmium chloride (CdCl2.2.5H2O), tellurium(reagent powder), sodium borhydride(NaBH4), mercaptoacetic acid and cysteamine were obtained from Sigma. BRCAA1 plasmid was reserved by our group. SYBR Green I-based quantitative PCR kit was from the Takara Company. PCR primers for amplifying BRCAA1 gene were designed and synthesized by the Shanghai BioEngineeirng Company. The sequences were as follows: upstream primer of BRCAA1: 5’-TACCAAATCTCCCGCAAGG-3’; downstream primer of BRCAA1: 5’-TCATATTTTCCAGGTCCG ACA-3’, the yield is 410 bp in length.
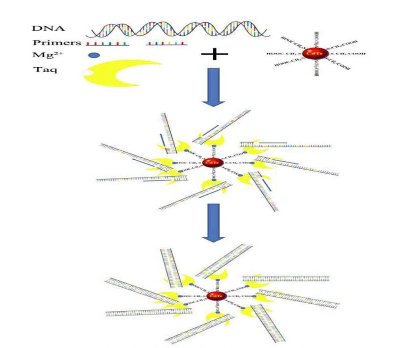
Scheme 1. Schematic principle of real time PCR based on mQDs
2.2 Preparation and characterization of mQDs
In a typical synthesis [26-27], 5 mmol of CdCl2.2.5H2O was dissolved in 110 mL of water, and 12 mmol of TGA were added under stirring, followed by adjusting the pH to 11 by dropwise addition of 1 M NaOH solution. The mixed solution was placed in a three-necked flask deaerated by N2 bubbling for 30 min. Under stirring, 2.5 mmol of oxygen-free NaHTe solution was injected into the three-necked flask, which was freshly prepared from tellurium powder and NaBH4 (molar rate of 1:2) in water at 0 ℃. The resulting mixtures were refluxed at 100 ℃ for 4 h. The synthesized mercaptoacetic acid-modified CdTe nanocrystals(mQDs) solution was about 4mg/mL, and were characterized by high-resolution electron microscopy(HR-TEM) and X-ray diffraction(XRD). Charge properties were determined by Zeta potentiometer, with a concentration controlled at 0.4 %.
2.3 Effects of components and cycles of PCR on PL property of mQDs
In the PCR tubes with 3 μL mQDs and 30 μL PCR buffer, primers, templates, Mg2+ ions, and Taq DNA polymerase were respectively added into the PCR tubes, fully mixed ,and then the PL spectra of mQDs were measured by a PerkinElmer LS 55 spectrofluorimeter. The PCR components were as follows: 3 μL 10× PCR buffer, 3 μL 2.5 mM dNTP’s, 3 μL 1.5 mM MgCl2, 1 μL upstream and downstream primer each, 2 μL 0.1 μg /mL DNA templates, 15 μL ion-free water, 1 μL Taq enzyme(2U), and 2 μL of mQDs. The PCR condition: pre-denaturation at 94 °C for 2 min, denaturation at 94 °C for 35 s, annealing at 55℃ for 42 s, extension at 72 °C for 50 s, 30 cycles. The photoluminescent (PL) intensities of the products after every PCR cycle were measured by a PerkinElmer LS 55 spectrofluorimeter.
2.4 Effects of mQDs on the sensitivity of PCR
The reaction condition was as follows: pre-denaturation at 94 °C for 4 min, denaturation at 94 °C for 35 s, annealing at 55 °C for 42 s, extension at 72 °C for 50 s, 35cycles, and final extension at 72 °C for 10min. The PCR products were 410 bp in length. 3 μL mQDs were added to the PCR liquids; then the templates were diluted gradually and added into the PCR tubes. Control experiments were conducted without mQDs, but other conditions were the same. The photoluminescent (PL) intensities of the products before and after the PCR reaction were measured by a PerkinElmer LS 55 spectrofluorimeter. The final products were analyzed by 1.2 % agarose gel electrophoresis.
2.5 Effects of mQDs on the specificity of PCR
We employed an error-prone, two-round PCR21 to investigate the function of mQDs. The sequences were as follows: Upstream primer of BRCAA1: 5’-CCAGAGTGAAAGATGCTCAG-3’, downstream primer ofBRCAA1: 5’-CTCCATTGTAAACTTTGG-3’. 15 PCR tubes were prepared, then were added: 3 μL 10× PCR buffer, 3 μL 2.5 mM dNTP’s, 3 μL 1.5 mM MgCl2, 1 μL upstream and downstream primer each, 2 μL 0.1 μg /mL DNA templates, 16 μL ion-free water, 1μL Taq enzyme(2U), 1 μL, 2 μL, 3 μL, and 4 μL of mQDs were added to the different 3 tubes with PCR reaction liquids, and then the PCR tubes were put into the PCR instrument. The first course of the two-round PCR was as follows: pre-denaturation at 94 °C for 4min, denaturation at 94 °C for 35 s, annealing at 30 °C for 42 s, extension at 72 °C for 50 s, 30 cycles. The second-round PCR was carried out under the same conditions, except that the final extension was run for 10min. The PCR products were 410 bp in length. The control PCR without mQDs was finished in the second-round PCR. The photoluminescent (PL) intensities of the products before and after PCR were measured by a PerkinElmer LS 55 spectrofluorimeter.
2.6 Comparison of two real-time quantitative PCR methods
The real time-PCR conditions were as follows: 95 °C for 35 s and 59° C for 50 s, 40 cycles. Under these conditions, we finished the PCR reactions using a Bio-Rad IQ5-type PCR cycler. In the experiment group, mQDs were added to the premix Ex Taq reagent (from the Takara Company) at 1 μL, 2 μL, 3 μL, 4 μL and 5 μL in the control group, SYBR Green I was added to the premix Ex Taq reagent.
2.7 Structure analysis of Taq enzyme combined with CdTe nanoparticles
Circular dichroism spectra of Taq before and after the conjugation to CdTe nanoparticles. The spectra were recorded on a JASCO J -500A spectropolarimeter in Fudan University. The 10000U Taq enzyme was dissolved in 0.01 M PBS buffer. A sample of CdTe, cysteine-stablized nanoparticles, and the conjugate samples were at pH 7.4. The initiation solutions were diluted to approximately 1mg/mL concentration of Taq immediately before the spectra were taken. A JASCO cell of path length 0.10 cm was used.
3 Results and Discussion
3.1 Characterization of synthesized CdTe quantum dots
Mercaptoacetic acid (m)-and cysteamine (c)-modified CdTe nanocrystals were synthesized. As shown in Figure 1, XRD shows that the obtained nanocrystals belong to the cubic (zinc blende) structure which is also the dominating crystal phase of bulk CdTe, HR-TEM shows that they have diameters about 3 nm, and Zeta potential measurement shows that they have negative and positive charge, respectively. We observed that two synthesized CdTe quantum dots are watersoluble and very stable up to 2 years.
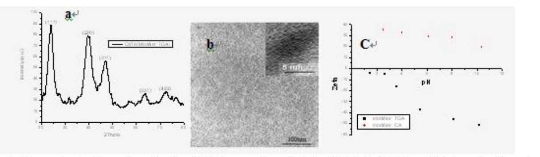
Figure 1. Characterization of synthesized CdTe quantum dots by XRD, HR-EM and Zeta potentiometer. a: XRD spectra shows Cd and Te elements; b: HR-TEM image of CdTe nanocrystals shows that the synthesized CdTe nanocrystals is 3nm or so in diameter; c: Zeta potentiometer measures the surface charges of m-CdTe and c-CdTe quantum dots, m-CdTe quantum dots is with negative charge, c-CdTe quantum dots is with positive charge.
3.2 Effects of templates and primers on the PL property of mQDs
Figure 2 shows the PL spectra of mQDs in final products of PCR based on different amounts of templates. As the amounts of initial templates increased, the PL intensity decreased gradually, which represents an almost negative linear relation to the DNA concentration logarithm, and the PL peaks did not exhibit red-shifts, which showed that double-strand DNA templates can quench the fluorescent signal of as-prepared mQDs in dose-dependent means, and the fluorescent quenching intensity may be used to quantify the DNA templates. The oligo primers do not affect the PL intensity of mQDs in the PCR reagents with 10 pM primers( data not shown). The c-CdTe quantum dots also were added into the PCR reagents, they quickly aggregated and precipitated, and markedly inhibit PCR. Therefore, we finally selected mQDs as the dye for real-time PCR.
3.3 Effects of PCR cycles on the PL property of mQDs
As shown in Figure 3A, as the PCR cycles increased, the PL intensity gradually decreased, and the PL peaks gradually red-shifted. Figure 3B shows that the PL intensity of mQDs has an almost negative linear relation to the PCR cycles. As the PCR cycles increased, the resulting increased products can quench the fluorescent signal of the mQDs. When the PCR cycles reached 40, the PL intensity of the PCR products decreased almost to zero, as shown in Figure 6. Therefore, measuring the PL intensity of mQDs in the PCR products, we may calculate out the amount of PCR products.

Figure 2. Effects of DNA templates on PL property of mQDs (A) The PL spectra of PCR reagents with 1 μL of 0.4 % mQDs under gradually increased DNA plasmid templates from 0.ng (7), 1.25 ng/mL (6), 2.5 ng/mL(5), 5 ng/mL (4), 10 ng/mL (3), 20 ng/mL (2), to 40 ng/mL (1). (B) The curve of relationship between PL intensity of mQDs and amount of DNA templates. (C) The curve of relation between PL intensity of mQDs and logarithm of DNA template concentration.

Figure 3. PL spectra of mQDs as PCR cycles increase. (A)PL intensity under different PCR cycles. (B) Relation between PL intensity and PCR cycles.
3.4 Effects of Mg2+ ions on PL property of mQDs
As shown in Figure 3B, under the identical condition of PCR, as the amount of Mg2+ ions in the PCR reagent increased, the PL intensity of the mQDs decreased accordingly, and the PL peaks gradually red-shifted. These results showed that Mg2+ions can quench the fluorescent signal of mQDs in a dose-dependent means. The mQDs have negative charge on their surface, can bind with Mg2+ ions, dynamic quenching mechanism may be responsible for this phenomenon, similar to previous reports [27-28].
3.5 Effects of Taq enzyme on PL property of mQDs
As shown in Figure 5, Taq DNA polymerase enhanced the PL intensity of the mQDs in a dose-dependent means, and the PL main peak exhibited red-shifted, which showed that there is a strong interaction between the Taq DNA polymerase and the mQDs. In order to investigate further interaction between Taq enzyme and mQDs, we measured the CD spectra of Taq enzymes and mQDs-Taq enzymes, as shown in Figure 6, mQDs can bind with Taq enzymes, and changed Taq enzyme’s structure. Our data also showed that the mQD-Taq composites own more stable structure than Taq under the condition of PCR 3 temperature point cycles, and also existed fluorescent resource energy transfer between mQDs and Taq enzyme(data not shown). Regarding the potential mechanism, generally, we consider that there exist some defects on the surface of synthesized mQDs, proteins such as Taq enzymes can cover the surface of mQDs, and repair the defects of mQDs, therefore Taq enzymes can enhance the PL intensity of the mQDs. This phenomena is similar to Mamedova, et al’s report, the antenna effect may happen between Taq enzyme and CdTe quantum dots, may result in a significant increase of mQDs emission [29-30]. Regarding the effects of temperature on PL intensity of mQDs, we observed that, the temperature did not result in the enhancement of PL intensity of mQDs, conversely, for higher temperature such as more than 100 °C and longer times such as more than 2 hours, the PL intensity of mQDs decreased correspondingly. Similarly, for longer times and higher temperatures, the luminescence intensity of the mixture of Taq enzyme and mQDs also decreased accordingly due to oligomerization and denaturation of Taq enzymes.
3.6 Effects of mQDs on the specificity of PCR
As shown in Figure 7A, as the amount of mQDs in the PCR reagent increased to within the scope of 0.03-1.33 mg/mL, the smear bands of products of the two-round PCR gradually disappeared; after the concentration of mQDs in the PCR reagent increased up to 2.66 mg/mL, PCR amplification was completely inhibited. This result demonstrates that mQDs can improve the specificity of PCR. As shown in figure 7B, during the course of PCR, as the amount of mQDs in the PCR reagent increased, the PL intensity of the mQDs in the final products also increased accordingly, but their PL intensities were markedly lower than they were before PCR. All the PL main peaks of the final products had an identical red-shift of 24 nm (from 576 nm to 600 nm).
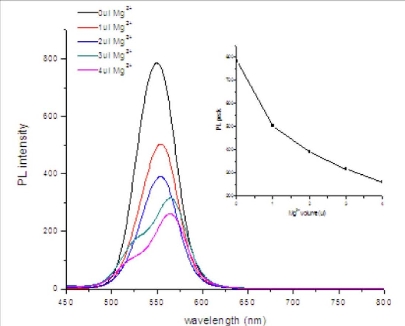
Figure 4. PL spectra of mQDs under different amounts of MgCl2. (A) PL intensity spectra under the condition of PCR reagent with 0 μL, 1 μL, 2 μL, 3 μL, 4 μL of 25 mM Mg2+ ion, respectively. (B) Relation curve of PL intensity as a function of Mg2+ ion concentration.
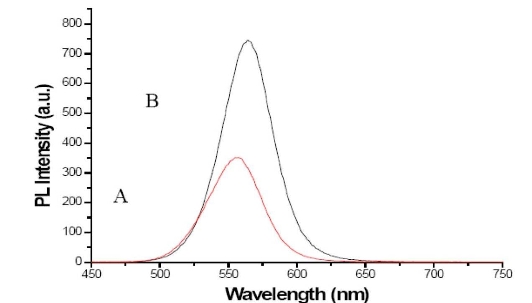
Figure 5. PL spectra of mQDs in PCR buffer with and without 8U Taq DNA polymerase. A. PL intensity spectra of mQDs without Taq polymerase. B. PL intensity spectra of mQDs with 8U Taq DNA polymerase, PL main peak exhibits red-shift.

Figure 6 CD spectra of Taq polymerases and CdTe QDs-Taq polymerases(A); Atomic Force Microscope image of Taq-mQDs composites (B).
3.7 Comparison of two real-time quantitative PCR methods
As shown in Figure 8 (a-d), as the initial templates were gradually increased, the fluorescent signal intensity gradually decreased, and the real-time quantitative curves based on mQDs shifted down accordingly; in addition, the Ct (threshold cycle) value showed almost no change. As shown in Figure 8 (e-h), as the initial templates were gradually increased, the fluorescent signal intensity increased gradually, and the real-time quantitative curves based on SYBR Green I gradually shifted to the left; in addition, the Ct value also accordingly decreased from 28 to 12. When the serial dilutions of the starting template were used for real-time PCR, We observed that the mQDs are very sensitive to template copies; in fact, they can almost detect 2-3 copies per reaction. On the other hand, SYBR Green I-based real time PCR methods [30-31] are not at all sensitive to template copies: they cannot detect template copies unless there are equal to or more than 103 copies per reaction. After we repeated the experiments for eight times, under the lowest limit copies of templates such as 103 copies, the average Ct values for SYBR Green I and mQDs were 28±1.4 and 1.0±0.03, respectively. Under higher copies of templates, the average Ct values for SYBR Green I and mQDs were 12±0.75 and 1.0±0.03, respectively. That is, curve Cv (difference) value is 3 % for mQDs, and 5 % for SYBR Green I. Therefore, compared with SYBR Green I-based real-time PCR, the sensitivity of PCR based on mQDs was at least 10 3 fold higher. In short, there is a statistical difference between the sensitivities of the two methods (P<0.01): real-time PCR based on mQDs is more sensitive to fewer template copies than real-time PCR based on SYBR Green I. We also compared the stability of mQDs and SYBR Green I. Synthesized mQDs are water-soluble and very stable for up to two years under the conditions of darkness and a temperature less than 100 °C, and they do not change their PL intensity. SYBR Green I is also very stable under the conditions of darkness and a temperature less than - 20 °C, but under the conditions of darkness and room temperature, the dye of SYBR Green I quenches almost half of its fluorescent signal intensity within five days, and within one month, the fluorescent signal of SYBR Green I cannot be detected. Therefore, under the condition of darkness and room temperature, mQDs are more stable than SYBR Green I. Furthermore, in the course of PCR, the PL intensity of the mQDs regularly decreases, which is attributed to the interaction between the mQDs and the components of PCR, whereas the PL intensity of the SYBR Green I changes very little. We considered that addition of suitable mQDs into the SYBR Green I –based real time PCR reaction liquids, the sensitivity of PCR will be markedly enhanced.
3.8 Potential mechanism
Regarding the mechanism of mQDs improving the sensitivity of PCR, when fewer initial templates exist in the PCR liquids, as the PCR cycles increase, the PL intensity of the CdTe nanocrystals decreases accordingly – these fluorescent signals can be detected in real time from 1 cycle to 40 cycles (Ct=1). Conversely, in the course of real-time PCR based on SYBR Green I, when the template copies in the PCR liquids is at least > 103, as the PCR cycles increase, and when the PCR products increase – but the signal can be detected only when the PCR products reach a critical point (Ct=28) [32-35]. Therefore, we concluded that real-time quantitative PCR based on mQDs is more effective than PCR based on SYBR Green I for the detection of low copies of DNA templates. However, addition of suitable mQDs into the PCR reagent, will improve the sensitivity and specificity of PCR based on SYBR Green I. Regarding the mechanism of mQDs improving PCR specificity, as shown in Scheme 1, the addition of mQDs to the PCR reaction liquids can significantly change the distribution of reaction components. Because of their identical surface charges, the CdTe nanocrystals repel one another and do not aggregate, Mg2+ ions bind with mQDs, resulting in the formation of Mg2+ ions covered mQDs, then, bind with Taq DNA polymerase and form the mQD -Taq composites, and then, the PCR primers and DNA templates are attracted toward Taq-Mg2+ -mQDs composites because of Van der Waals and electrostatic interactions. When the repulsion and attraction reach a dynamic balance, the Taq-Mg2+ -mQDs composites in the PCR solution become very stable and water-soluble, and forming many small reaction centers, PCR reactions were finished on the surface of Taq-Mg2+ -mQDs composites. The mQDs enhanced the stability of structure of Taq enzyme, and markedly improve the bioactivity of Taq enzyme including catalyze activity and exonuclease activity, the enhanced catalyse activity improves the sensitivity of PCR, the enhanced exonuclease activity enhances the specificity of PCR. At the stage of template denaturing in the course of PCR, as the temperature increases rapidly, the thermal entropy in the reagent and the surface potential energy of the Mg2+-mQDs composites also increase, all the components speed up the Brown motion, which raises the probability of dynamic contact among the primers, DNA templates, and Taq DNA polymerase around the Mg2+-mQDs composites, which, in turn, enhances the probability of right base-pairing between primers and DNA templates [36-40]. At the stage of anneal, as the temperature decreases, the primers simultaneously begin to bind with single-strand DNA templates around the Mg2+-mQDs composites; at this point, Mg2+-mQDs composites may release their surface potential energy, which may improve the chance that primers will bind with single-strand DNA templates, which in turn will decrease or eliminate the probability of wrong base-pairing between primers and single-strand DNA templates [41-43]. At the stage of extension, Mg2+-mQDs composites continue to release their surface potential energy, which improves the Taq DNA polymerase-catalyzed double-strand DNA synthesis. On the other hand, the Mg2+ - mQDs composites may enhance the function of Mg2+ ions as a catalyst for Taq DNA polymerase [44-45], enhancing the correcting-mistakes activity of Taq DNA polymerase, markedly enhancing the probability of right base-pairing between bases and single-strand DNA templates. the enhanced exonuclease activity enhances the specificity of PCR. However, this kind of dose-product effect has an optimum concentration of mQDs. After passing the critical point (1.33 mg/mL), mQDs inhibit PCR. The further mechanism is still under way. In conclusion, mQDs can improve the sensitivity and specificity of PCR within less than 1.33mg/mL, which enhanced the catalyse and exonuclease activity by mQDs-binding with Taq enzyme. The sensitivity of PCR based on mQDs is at least 103 fold higher than the sensitivity of PCR based on SYBR Green I. The sensitivity of real time PCR based on SYBR Green I can be improved by addition of mQDs into the PCR reaction liquids. The mQDs improve the specificity of PCR within 1.33mg/mL. The PL intensities of mQDs in PCR decrease in an almost negative linear relation to the DNA concentration logarithm or cycles, and the PL peaks exhibit red-shifts synchronously, which supports the use of mQDs as a dye in real-time PCR. Surface structure and properties of mQDs should be responsible for these phenomenon, these observations potentially can lead to applications such as ultra-sensitive specific real time pathogenic detection, dynamic molecular imaging, and photoelectric biosensors.
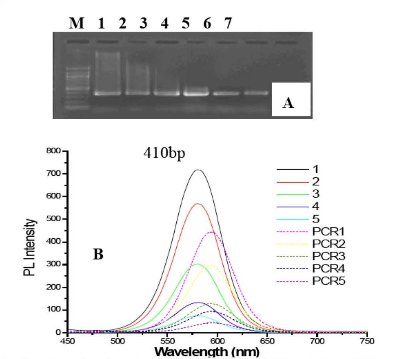
Figure 7. Gel electrophoresis result and spectra of mQDs. (A) Image of PCR products by 1.2 % agarose electrophoresis. M = Molecular marker, No. 1-7: PCR products with 0.03, 0.07, 0.13, 0.27, 0.53, 1.33, 2.66 mg/mL mQDs, respectively, PCR products are 410 bp. (B) PL spectra of mQDs under the condition of PCR reagent with gradually increased mQDs. No.1-5: PL spectra of primitive PCR liquids with 0.53, 0.27, 0.13, 0.07, 0.03 mg/mL mQDs before PCR; PCR 1-5: PL spectra of matched mQDs after PCR.
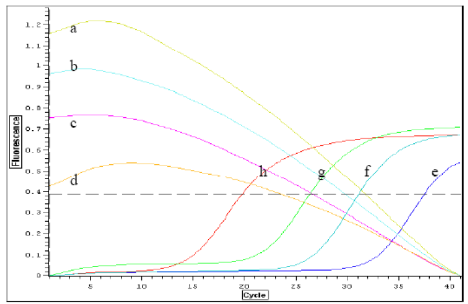
Figure 8. Real-time quantitative PCR curves based on SYBR Green I and mQDs. e, f, g, h: curves of real-time quantitative PCR based on SYBR Green I with respective 1000 copies, 2000 copies, 4000 copies, 8000 copies of initial templates; a, b, c, d: curves of real-time quantitative PCR based on mQDs with respective 1000 copies, 2000 copies, 4000 copies, 8000 copies.
Acknowledgments
The authors are grateful to Prof. Robert DiGiovanni of Waseda University for critical review and editing of the manuscript. This work was supported by the National Natural Science Foundation of China (No.20803040 and No.20471599), Chinese 973 Project (2010CB933901), 863 Key Project (2007AA022004), New Century Excellent Talent of Ministry of Education of China(NCET-08-0350), Special Infection Diseases Key Project of China (2009ZX10004-311), Shanghai Science and Technology Fund (10XD1406100). The authors also thank the Instrumental Analysis Center of Shanghai JiaoTong university for the materials characterization.
References
Received 15 January, 2010; accepted 15 February, 2010; published online 5 March, 2010.
Copyright: (c) 2010 D. Cui et al. This is an open-access article distributed under the terms of the Creative Commons Attribution License, which permits unrestricted use, distribution, and reproduction in any medium, provided the original author and source are credited.

|
Nano Biomedicine and Engineering. Copyright © Shanghai Jiao Tong University Press |
 |