Article
Fluorescent Signal Detection of Immunochroma- tographic Chip Based on Pyramid Connection and Gaussian Mixture Model
Beibei Hu1, Xueqing Zhang2,Haopeng Chen1*, Kan Wang2
1 School of Software; 2 Department of Bio-Nano-Science and Engineering, National Key Laboratory of Nano/Micro Fabrication Technology, Key Laboratory for Thin Film and Microfabrication of Ministry of Education, Institute of Micro-Nano Science and Technology, Shanghai JiaoTong University, 800 Dongchuan Road, Shanghai 200240, China
* Corresponding author. E-mail: chenhaopeng@gmail.com
Citation: B. Hu et al. Fluorescent Signal Detection of Immunochromatographic Chip Based on Pyramid Connection and Gaussian Mixture Model. Nano Biomed Eng. 2010, 2(3), 177-181. DOI: 10.5101/nbe.v2i3.p177-181.
Abstract
The detection of fluorescent signal in chromatographic chip is the key of disease diagnosis by immuno-chromatographic assay. We propose a new algorithm for the automatic identification of fluorescent signal. Based on the features of chromatographic chips, mathematic morphology in RGB color space is used to filter and enhance the images, pyramid connection is used to segment the areas of fluorescent signal and then the method of Gaussian Mixture Model is available to detect the fluorescent signal. At last we calculate the average fluorescence intensity in obtained fluorescent areas. It can be proved that the algorithm has a good effect to segment the fluorescent areas and it can detect the fluorescent signal quickly and accurately to achieve the quantitative detection of chromatographic chip through experimental data analysis.
Keywords: Chromatographic chip; Fluorescent signal; Image segmentation; Pyramid connection; GMM
1. Introduction
In recent years the early diagnose of major diseases such as liver cancer, AIDS is still in exploration stage.Immunochromatographic assay is a good method to detect disease quickly. It uses antigen and antibody as analytical reagents and makes quantitative analysis to determinand. Its basic principle is the specific antigen- antibody reaction [1]. Adopting new magnetic nanoparticle as chromato- graphy fluorescent markers for chip is a new plan. It can improve the detection sensitivity. The intensity of the fluorescent area reflects the interaction between antigen and antibody. Through the calculating of fluorescence intensity from a set of experiments of differ- ent concentrations of antigen-antibody reaction, we can do quantitative analysis of corresponding relations be- tween antigen concentration and fluorescence intensity, thus achieve the goal of virus detection. In order to acquire the information of fluorescent signal automatically in chromatographic chip, we propose a new method to detect the fluorescent signal combined with the features of chip images. Mathematic morphology in RGB color space [2-4] is used to filter and enhance the images, pyramid connection [5, 6] is employed to segment the areas of fluorescent signal and then the method of Gaussian Mixture Model [7-9] is available to detect the outline of fluorescent signal. At last we do quantitative analysis [10, 11] by calculating the average fluorescence intensity in obtained fluo- rescent areas. It can be proved that the algorithm has a good effect to detect fluorescent signal through expe- rimental verification. This paper has five chapters. The first part is the in- troduction. The second and the third parts describe the algorithm. The fourth part verifies the validity of the algorithm via data analysis and at last we make conclu- sions about the method we proposed.
2. Background
2.1 Mathematical morphology
It usually generates random noise in the process of preparation, cleaning, scanning of immunochromato-graphic chips. The noise in chip images will affect the recognition of the fluorescent signal. We use the me-thod of color image morphology [12] to denoise. V(x) signifies the color image in RGB space, is the planar structural element and , mathematical morphological operations can be expressed as follows:
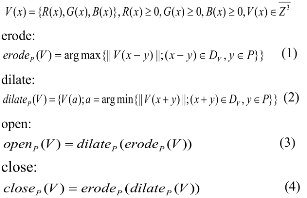
The selection of structural element P takes into ac-count two factors: the size of fluorescent area and the noise. We should keep the fluorescent details in the basis of decreasing noise.
2.2 Pyramid segmentation
Pyramid is composed by a series of layers, analysis operators achieve the transformation from the lower level to the higher one and composition operator is op-posite in each step [13]. Usually the low resolution im-ages are used to analyze the obvious structure, and high resolution images are used to analyze the details. The pyramid process should establish a simple py-ramid system at first and then the adjacent layers form father-child relation. We set two threshold values, thre-shold1 and threshold2. Threshold1 is the error thre-shold value for building connection and threshold2 is the error threshold value of segmental cluster. If the gray value between the pixel an in layer i and the pixel b in adjacent layer is lesser than threshold1, then a and b are connected. After defining the connection, areas Aand B belong to the same cluster in the case that the average gray value between A and B is lesser than thre-shold2.
2.3 Gaussian mixture model
Gaussian Mixture Model [14, 15] is the extension of a single Gaussian probability density function. The probability density function of Gaussian Mixture Mod-el is obtained by the summation of M Gaussian proba-bility-density functions:
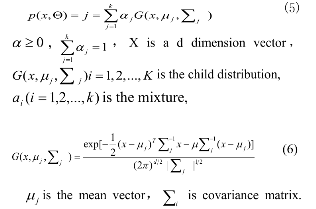
Figure 1 is a Gaussian Model (k=3). Complete Gaussian Mixture Model is composed by parameter, mean vector, the covariance matrix and the mixture of weight. It’s as follows:
![]()
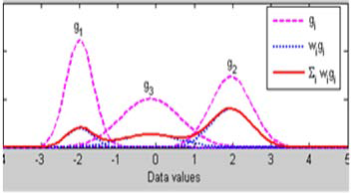
Figure 1. Gaussian Mixture Model (k=3)
3. Detection Algorithm
First the immunochromatographic chip image is en-hanced by mathematic morphology. We choose a 9×9 structural element. In the morphological image applica-tion, open operation is usually used to filter, close op-eration is usually used to reduce the noise. They are not inverse operations. We apply concatenation to chip image filtering. Combined with the features of fluores-cent signals, we adopt the method of open-closing. It’sproved to be effective in image denoising and detail-preserving. After morphological filtering, we employ pyramid connection [16] to segment fluorescent foreground and background preliminarily. It uses the pyramid structure. In the bottom of the pyramid, the number of nodes is the number of pixels in the original image. Each node includes the eigenvalues via calculating image. When it moves toward upper layer, the size and the resolution is reduced, and the initial value in the top is obtained through the calculation of the mean value in low-level nodes. Each node from adjacent layers is connected since the bottom of the pyramid after the pyramid has been built up. The iterative process of the algorithms is as follows:
(1) Calculate the Gaussian pyramid. In the experi-ment we adopt the Gaussian_4×4 template to build up the pyramid.
(2) Establish the father-child relation. There are four eigenvalues in the node (i, j) of l th label:1)local im- age characteristic value: c[i, j, l][t] ;2)the area of charac- teristic areas: a[i, j, l][t]; 3)the pointer towards the father node:p[i, j,l][t] ;4)segmentation features: s[i, j, l][t] ,t is the iteration number( t ≥ 0 .There are 16 child nodes (i ' , j ' ) in the ( l − 1 )th layer and 4 father nodes in the ( l + 1 )th layer, which correspond to every node in the l th layer. In each layer below the top of pyramid, for each iteration t, all nodes are established father-child relations.
(3)After defining the father-child relation, the values of t, c and a should be calculated from the bottom layer to the top layer.
a[i, j,0][t] = 1, c[i, j,0][t] = c[i, j,0][0],
if a[i, j,0][t] = 0, there is no child node, if a[i, j, l][t] > 0, then:
c[i, j, l][t] = Σ(a[i' , j' , l −1][t]⋅ c[i' , j' , l −1][t]) / a[i, j,l][t]. c is the key to control the iterative process. In each layer, s of each node is c of its father node. s[i, j, l][t] = c[i '' , j '' , l + 1][t]. The iteration process stops when c has no change.
Gaussian Mixture Model is used to detect the fluo-rescent signal in the basis of pyramid seg-mentation. The main algorithm steps are as follows:
(1) We select interested fluorescent areas according to the background and foreground which have been segmented by pyramid connection.
(2) EM algorithm is used to estimate the parameters of Gaussian Mixture Mode. EM [17] has two steps, E step and M step. It maximize incomplete data of logarithm likelihood function through complete the expec-tation of logarithm likelihood function iteratively. E-step: calculate the expectation of logarithm likelihood function of complete data. M-step: acquire the new parameterby maximization. Through the alternate process of the two steps, EM algorithm gradually im-prove model parameters, which make parameters and the training sample likelihood probability increase gradually, finally end in a maximize point, and then we realize the parameter estimation. Eventually a Gaussian distribution is generated.
(3) Then we employ GMM to estimate approximate-ly probability distribution [18]. When k equals 6, it can get the best result through experimental analysis. Tra-verse each pixel in the image and calculate the proba-bility of it belongs to background and foreground. Compare the two probabilities and classify the pixel in the bigger one. After traversal, we get the divisional fluorescent areas.
4. Experimental Results
4.1 Image filter
In order to clarify the problem briefly and verify the algorithm, we choose one chip image for exam-ple.Fig.2-(a) is the original image. According to the features of immunochromatograph-ic chip image, in order to denoise image and enhance fluorescent signal, we select a black 9×9 structural element to do open-close concatenation operation in RGB color space. The result is as follows:
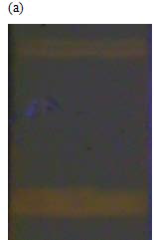
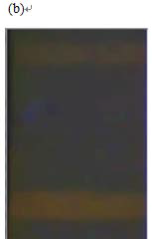
Figure 2. (a) Original image (b) Result by morphology filter
We finally acquire the two yellow fluorescent areas (surveyed area and QC area). Noise exists in the origi-nal image, and after filtering, we could see background noise is decreased and it gets ready for image segmen-tation.
4.2 Outline detection of fluorescent signal
Fig.2-(b) is the result of primary segmentation by pyramid connection. From the contrast of gray histo-grams of original image and the image treated by py-ramid (Fig.2-(d)(e)), it can be observed that the back-ground noise is decreased and image contrast is en-hanced. On this base, GMM is used to segment the fluorescent areas and detect the final fluorescent out-line.Fig2-(c) is the final result.
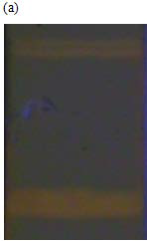
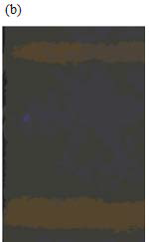
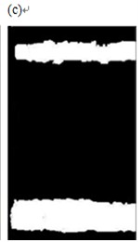
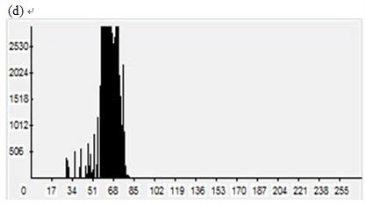
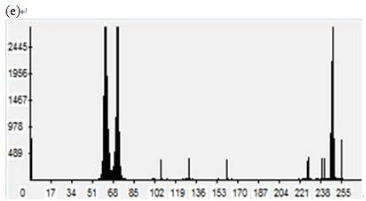
Figure 3. Fluorescent segmentation results,(a)original im-age,(b)result by pyramid segmentation, (c)result by GMM, (d)original image histogram,(e)pyramid segmentation image histogram
4.3 Fluorescent signal data analysis
Averaging method is a widely used statistical me-thod. It acquires the fluorescence intensity through the statistics of the average light density of all pixels in fluorescent area. Fluorescence intensity reflects the interaction between antigen and antibody to a certain extent. The algorithm we proposed could extract the fluorescent areas and detect the fluorescent signal so that we can analyze the correlation between fluores-cence intensity and reacting concentration of antigen quantitatively. We collect a group of chromatographic chip images of antigen of different concentration combined with antibody. The fluorescence intensity is calculated via the method we proposed. We make the following chart according to the experimental data. Figure 4 shows linear relation between fluorescence intensity and concentration of antigens, the red line is fitting straight-line based on the data in Chart1, f (x) = 883.53487x +133.58974 , degree of fit-ting is 0.9926. According to the figure above, we can get the con-clusion that average intensity in detected fluorescent area has linear relationship with concentration of anti-gens .It provides important basis for quantitative analy-sis of information from immunochromatographic chip and verifies the validity and accuracy of the algorithm.
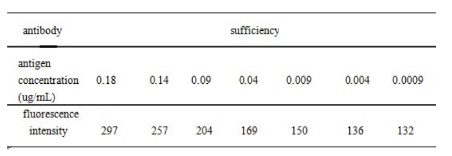
Chart1 Fluorescence intensity value of a group of chromato-graphic chip images
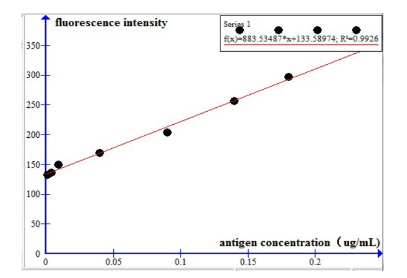
Figure 4. Linear relation between fluorescence intensity and concentration.
5. Conclusions
The experimental results show that the algorithm of the paper has very good effect to detect fluorescent signal of immunochromatographic chip. It can detect fluorescent signal accurately to realize quantitative analysis of immunochromatographic chip. The effi-ciency is also considered, the calculation of pyramid segmentation is fast and efficient, GMM is used to detect the outline and realize the quantitative analysis of immunochromatographic chip. The method has a good application prospect in the detection of fluores-cent signal from immunochromatographic chip. It can complete automatic information extraction for immu-nochromatographic chip marked with quantum dot and it makes sense to extract biochip information automati-cally and precisely.
Acknowledgements
I would like to express my gratitude to all those who helped me during the writing of this thesis. I gratefully acknowledge the help of my teachers, Prof. Cui Dax-iang and Mr. Chen Haopeng who have offered me val-uable suggestions in the academic studies.
References
Received 20 Jul, 2010; accepted 20 Sep, 2010; pub-lished online 1 Oct, 2010.
Copyright: (C) 2010 B. Hu et al. This is an open access article distributed under the terms of the Creative Commons Attribution License, which permits unre-stricted use, distribution, and reproduction in any me-dium, provided the original author and source are cre-dited.

|
Nano Biomedicine and Engineering. Copyright © Shanghai Jiao Tong University Press |
 |