![]()
Article
Improved Visualisation of Internalised Carbon Nanotubes by Maximising Cell Spreading on Nanostructured Substrates
Chenchen Bao 1,‡, Furong Tian 2,‡,*, Giovani Estrada 3
1 National Key Laboratory of Nano/Micro Fabrication Technology, Shanghai Jiaotong University, Shanghai 200240, China.
2Comprehensive Pneumology Centre, Institute of Lung Biology and Disease, Helmholtz Zentrum München, Ingolstaedter Landstr. 1, D-85764 Neuherberg, Munich, Germany.
3Institute for Bioinformatics, Helmholtz Zentrum München, Ingolstaedter Landstr. 1, D-85764 Neuherberg, Munich, Germany.
‡Chenchen Bao and Furong Tian contributed equally to this work.
*Corresponding authors. Email: furong.tian@helmholtz-muenchen.de
Citation: C. Bao, et al. Improved visualisation of internalised carbon nanotubes by maximising cell spreading on nanostructured substrates. Nano Biomed. Eng. 2010, 2(4),201-207. DOI: 10.5101/nbe.v2i4.p201-207.
Abstract
The subcellular visualisation of nanomaterials is crucial for a wide range of studies in nanomedicine and nanotoxicology. Although light microscopy usually requires less demanding sample preparation, compared to electron microscopy, it suffers from occlusion and resolution when observing nanoparticles. A main difference in the sample preparation is the reduction of cell’s thickness. Here we propose an improved light microscopy setting in which cells are spread on nanostructured patterns as to minimise their thickness, and at the same time minimise the overlap of nanoparticles themselves. Nanostructured substrates were prepared by depositing functionalised gold-RGD nanodots. We optimise the experimental conditions as to minimise cell’s thickness, which literally flattens the cell for further imaging procedures. The improved conditions are attained when cells reach their maximum spreading, and it is found when the dot-dot distance is 58nm. A threshold mechanism in cell adhesion is explained. When cells are maximally flat, confocal microscopy can easily detect the subcellular location of individual carbon nanotubes. This is a novel imaging concept with many potential applications in nanosciences, especially when a fast, reliable and inexpensive visualisation of nanoparticles is required.
Keywords: Gold nanodots; cell adhesion; confocal microscopy;
Carbon nanotubes (CNTs) are one of the studied nanomaterials in nanotechnology. CNTs provide exciting mechanical properties that allow the creation of novel, strong and lightweight products. There is a growing interest in developing nanoscale materials for biomedical applications as well. The ability of engineered nanoparticles to interact with cells and tissues at a molecular level is a subject of intense research [1].When cells or tissues are exposed to nanomaterials, we often need to perform quantification and subcellular deposition studies. Imaging nanoparticles is thus a subject itself. If we ask for easier sample preparation and fast imaging, the problem turns even more difficult to approach. Independently on their shape, nanoparticles can be fluorescently functionalised as to improve their detection. Spherical nanoparticles, for instance polystyrene beads, can be routinely visualised with both light and transmission electron microscopy. An accurate, fast quantification and subcellular localization are nevertheless different issues to address at once. Occlusion of nanoparticles by cellular components, like the cytoskeleton, and overlap of nanoparticles themselves hampers most attempts at implementing quantitative imaging. More complicated shapes, like CNTs, are difficult to visualise due to overlaps. CNTs are both nano and micro scale materials, with lengths often seen in several microns and up to centimetres long [2]. Ultrathin sectioning of samples for subsequent imaging under electron microscopy is a well-established technique for the visualisation of nanoparticles. Nevertheless, sample preparation is both time consuming and prone to errors. Conversely, light microscopy is relatively easier, but it suffers from occlusions due to a lack ofcontrol on sample’s thickness. For a sample to be easily visualised under light microscopy, it should reduce its thickness. Here, we propose a nanostructured-based approach that minimise cell’s thickness while maximising cell spreading. First of all, we need to control the nanostructured substrate as to provide certaincharacteristics promoting cell spreading. When cells adhesion is at its threshold, light microscopy can provide fast, reliable imaging conditions. Recently, a similar idea of reducing cell’s thickness was successfully applied to improve light microscopy conditions for spherical, fluorescent polystyrene nanobeads [3,4]. Macrophages internalised nanobeads, and were subsequently observed under confocal microscopy for further quantitative analyses. Cell’s thickness was gradually reduced by varying the concentration of fibronectin, up to the point in which it reaches its minimal cell thickness at 1.59 ± 0.2 μm [3,4].At this point, a reduced number of layers are required in confocal microscopy and the overlap of nanobeads is greatly reduced. This reduced number of planes to scan is usually seven or ten times lower than without substrate treatment. Consequently, it also reduces the acquisition time and eventual data storage’s size. As thickness is reduced, nanobeads were packed into large, uniform blocks near the nucleus. It is here, around the nucleus,where free space is to be found, and where potential overlap occurs. The packing is in fact advantageous; we now know where nanoparticles deposit. The flattening effect in macrophages eases light microscopy and therefore improves the quantitative assessment of nanoparticles. Fibroblast cells, however, posses a rather different adhesion mechanism. It can create a lot more focal adhesion points than macrophages. The stepwise control of fibroblasts’ thickness turns to be quite difficult. A controlled minimisation of cell’s thickness, based on fibronectin, is therefore more complicated to achieve with fibroblasts. Fortunately, fibronectin is not the only way to promote and control cell adhesion. Here we propose a more general method to do so. To minimise cell’s thickness we employ a nanostructured substrate. Nanostructured substrates or nanoscaffolds allow spatial control of a small number of chemical units on a molecular scale. The responses of cells to diverse topographical features, eg. nanopillars and nanogrooves, have been known for decades [5-7]. A recent theme in nanostructured substrates has been focused on methods that can control the positions of ligands. Cells can react to sub-micrometer features, ranging between 50 and 500 nm, by changing their adhesion, morphology and gene expression [8]. Therefore, precise and homogeneous topographical features need to be implemented throughout the same substrate. For instance, nanostructured substrates with regularly-spaced points in the range of 100 nm have been successfully employed to induce a switch in cell behaviour [9]. Cell growth and viability, for instance, can be controlled with the ligands density, orientation and especially spacing at length scales from 10-200 nm [10]. Moreover, photolithography and electron beam lithography have been long used in nanotechnology industry, eg. electrical and electronics products, but are relatively new in tissue engineering products. Here we present a nanostructured-based improvement to confocal microscopy. Since cell-substrate interactions involve recognition of nano scale features, we aim at visualising this scale length: internalised CNTs in cells attached to gold nanodots. We do so by developing a homogeneous patterning strategy based on self-organising diblock copolymer micelles. In order to appreciate the nature of this procedure, we compare several imaging modalities. We present initial, encouraging results; and, we therefore think a reduction on cell’s thickness can greatly improve light microscopy and ease further tasks like quantification and precise subcellular location of internalized nanoparticles.
2. Materials and Methods
2.1 Nanostructured glass substrate preparation
The modification of silicon wafers or borosilicate glass substrates was performed using standard protocols for surface modifications. Nanostructured substrates were prepared according to a procedure reported in reference [11]. Substrates were cleaned in “piranha” solution consisting of a 3:1 ratio of 30% w/v aqueous solutions of H2SO4 and H2O2, washed with H2O, and dried under nitrogen. The PS-P2VP diblock copolymers, polystyrene-b-poly and poly(2-Vinyl Pyridine), formed in toluene micelles, with P2VP as the core and PS the shell. After interacting P2VP with HAuCl4, loaded micelles were produced. Glass coverslips were immersed into a toluene solution containing micelles of copolymers and loaded with gold (HAuCl4, Sigma) nanoparticles. The velocity of dipping was approximately 12 mm min-1. The polymer shell was removed by treating the coverslips with hydrogen gas plasma for 45 min at 180 Watt and 0.4 mBar, which caused the reduction of the metal core. An array of gold nanoparticles organised in quasi-hexagonal patterns on the dipped part of the coverslip was thus generated. Arginine-Glycine-Aspartic acid peptide (RGD) was conjugated with gold dots and a thiol group (SH).
2.2 Imaging nanostructured surfaces
A scanning electron microscope (SEM), Hitachi S-800, was employed to get images down to 10 nm. To visualize the gold nanoparticles on the surface, an acceleration voltage of 3 kV was applied under a pressure of 5x10⁻⁶ mBar. The magnification was 150000 times. Measurements with a Nanoscope III Atomic Force Microscope (AFM, Digital Instruments) were performed at ambient conditions. Topographic images were acquired in a tapping mode using silicon tips on integral cantilevers with a nominal spring constant of 30-67 Nm-1. In tapping mode, the cantilever (nanosensors) was excited near its resonance frequency with a piezoelectric driver, and the oscillation amplitude was used as a feedback signal to measure the topographic variations of the sample.
2.3 Cell culture
REF 52 cells, rat fibroblast lines, were cultured at 37°C and 5% CO2 atmosphere in an incubator. The medium was changed every 2 days. After the cells have reached confluence, they were first rinsed with sterile phosphate buffer saline (PBS) solution and then released with a trypsin-EDTA 2.5% (Gibco) solution for 3-5 min. After diluting them in 5-10 ml of complete medium and centrifugation at 1200 rpm for 5 min, the cell pellet was suspended in medium and cells were then replanted in cell culture flasks or in wells containing the substrates prepared for the adhesion studies.
2.4 Exposure of CNT to cells
Multi-wall carbon nanotubes, 50 nm wide and 5 μm long, were purchased from IIJIN (Diamond Co. Ltd, Korea). The cell-CNT sample preparation for fluorescent analysis was similar to previously-described cell culture preparation. Cells were incubated at 104 cells mL-1 with CNTs at 0.05 μmolL-1 solution for 2 hours. Cells were subsequently seeded and again incubated for another 24 hours.
2.5 Transmission Electron Microscopy
Samples were prepared for TEM in the following way. After an incubation time of 48 h, fibroblasts with CNTs and normal control cells were harvested and washed with phosphate buffer (pH=7.4). Afterwards, cells were washed by 0.01molL-1 PBS, and fixed for 2 h in 2.5% glutaraldehyde, which was previously dissolved in PBS (pH=7.4). The cells were incubated at 37°C for 5 min. They were embedded into 0.1% agar. This agar was fixed by 2.5% glutaraldehyde in PBS at 4°C for at least 2 h. The samples were washed with PBS, and then fixed in 1% osmium tetroxide at 4°C for 2 h. Cells were dehydrated in graded series of ethanol and later embedded in epoxy resin, as described in reference [12]. Since the material is exposed to a very high vacuum conditions (10-5 to 10-8 Torr) when being examined, it was dried at some stage in its preparation. Each biological specimen was stabilised, fixed, as to preserve its ultra structure under vacuum. The limited penetrating power of electrons requires specimens be sliced into ultrathin sections (50-100 nm) to allow electrons to pass through. Contrast in the TEM depends on the atomic number of the atoms in the specimen; the higher the atomic number, the more electrons are scattered and the greater the contrast; conditions easily attained in metallic or inorganic materials, but biological molecules are mostly composed of atoms of very low atomic number (carbon, hydrogen, nitrogen, phosphorus and sulphur). Therefore, thin sections of biological material were made visible by selective staining. The ultra-thin vertical cross sections (50 nm) of cells were observed under a transmission electron microscope, Philips CM10. Further down the scale, some samples with CNTs were also observed under a high resolution TEM, HRTEM, Philips CM200.
2.6 Cells and CNTs morphology
After cells were seeded onto nanostructured substrate and incubated for 24 hours in complete Dulbecco's Modified Eagle Medium, DMEM, cells were fixed with 4% paraformaldehyde in PBS at room temperature for 30 minutes. They were then washed again with PBS and permeated with 0.1% Triton X-100 for 3 minutes at room temperature. Cells were subsequently stained with mouse anti-actin (A4700, Sigma, Taufkirchen, Germany) and anti-α-tubulin (T4026, Sigma) antibodies by a Cy3 conjugated secondary anti-mouse antibody (F0257, Sigma) and ChromeoTM 642 Goat anti-Mouse I gG (Active Motif, Germany). Then, cell nuclei were stained by 10 mmolL-1 Hoechst for 1 minute. Finally the stained coverslips were mounted for fluorescence microscopic examination. Data were obtained using a Zeiss Laser Scanning Microscope (LSM 510 META, Zeiss, Germany). The LSM is an Axiovert 100M inverted research microscope, equipped with four laser sources [13].
3. Results
3.1 Substrate preparation and electron microscopy
Images of nanostructured surfaces were examined by SEM and AFM, as shown in Figure 1 and 2, respectively. After the assembly of micelles containing gold nanoparticles, the polymer was entirely removed with a gas plasma treatment, which results in extended and highly regular distribution of gold nanodots, deposited into a quasi-hexagonal pattern. Cores of micelles were anne aled to single gold nanodots during this process [14, 15]. Figure 1 shows a scanning electron microscopy image of one nanostructured substrate of gold nanodots (bright spots), in a seemingly regular distribution. The distances between gold nanodots is varied by using diblock copolymers of different molecular weight. In this particular example, the average size of gold nanodots was 8 nm. The topography of nanostructured surfaces can be further examined using AFM, see Figure 2. The AFM tip shows the surface’s topography consisting of gold nanodots deposited on the surface. The average is 6 nm high. Gold nanodots are functionalised with RGD to promote adhesion. It is here where focal adhesion points are created.
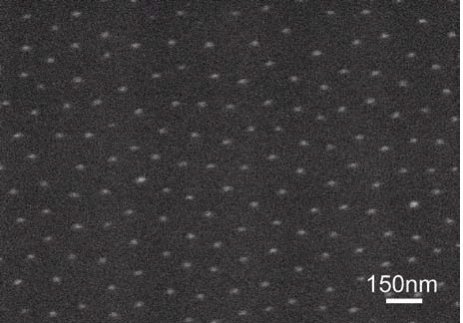
Figure 1. SEM image of one nanostructured surface shown regularlyspaced gold nanodots; the distance is predefined and depends on the molecular weight of employed diblock copolymers.
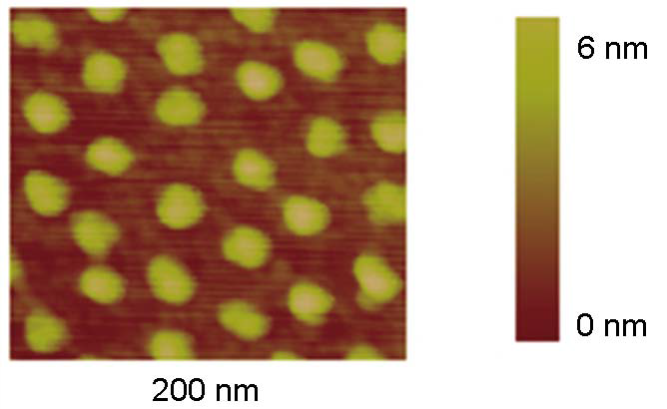
Figure 2. AFM image of gold nanodots, the scale bar shows the height of each dot.
3.2 Reduction of cell’s thickness on nanostructured substrates
Once a stepwise control of the dot-dot distance is achieved, we performed a series of experiments to find out the cell’s maximum spreading and minimum thickness. It is a key value if we want to reduce the number of layers to scan under confocal microscopy, or if we want to avoid, as much as possible, the overlap of nanoparticles. Figure 3 shows the most important parameters for this type of nanostructured substrates. Fibroblast cells could adhere well when the distance between gold dots was about 60 nm, whereas a distance of about 70 nm, and beyond, prevented cell adhesion. Figure 3 shows two distances that promote cell adhesion, namely ~20 nm and ~60 nm; as well as two distances that make it difficult to adhere, ~70 nm and ~90 nm. Although the transition between adhesion and non-adhesion might not be sharp, there is a threshold mechanism in the range 60-70 nm. Cell’s thickness reaches its minimum shortly before this threshold.
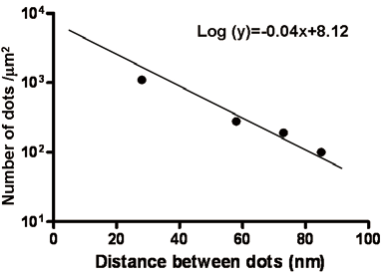
Figure 3. Number of dots and the distance between them on proposed nanostructured substrates. Adhesion of fibroblast cells to the nanostructured substrate has a threshold mechanism in the region 60-70 nm.
3.3 Adhesion and reduction of cell’s thickness
To test the fibroblast attachment and spreading on nanostructured substrates, a substrate with and without nanodots was created, see Figure 4A. The figure shows a light microscope images of cells cultured for 1 day on both sides of the substrate. In this control test, only half of the glass substrate area was patterned with gold nanodots, left panel of Figure 4A. The gold nanodots were functionalised with RGD peptides. A homogeneous, almost confluent lawn of cells covered the RGD nanostructured substrate with a dot-dot distance of 58 nm (Figure 4A, left panel). As expected in this control experiment, no cells could attach on substrates without gold nanodots, right panel Figure 4A. The distance between nanodots is crucial for cell adhesion. Figure 4B cell shows a nanostructured substrate in which the distance between dots is 73 nm. Few cells could adhere at this distance.
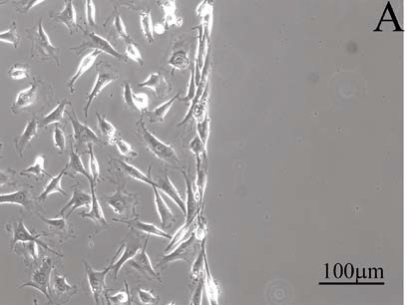
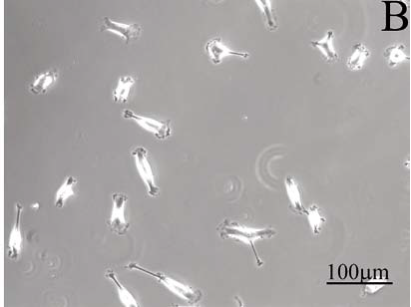
Figure 4. Light microscopy images of cells cultured on nanostructured substrates; (A) cells adhere to gold-RGD nanodots at 58 nm on the left side of one nanostructured surface. No nanostructure was created on the right side of this control substrate. (B) Few cells managed to adhere when the distance between nanodots is 73 nm.
3.4 Light microscopy
The microtubules showed a large diffused fluorescence staining. In fact, the green fluorescent carbon nanotubes entangled closely with the red stained microtubules, as shown in Figure 5A. In Figure 5B, actin filaments are red stained and showed a filopodia activity. Here, it can be seen that the green fluorescent staining emerges from the bundles of red stained actins (Figure 5A, B). Cells incubated with CNTs were plated on 58 nm substrate to ensure the maximum flattened attachment of the cells. Under these circumstances the microtubules bundle and link their fibres with each other to form a net-like mesh. Conversely to what was observed in spherical cells [3], the actin filaments orient their straight bundles into an aligned structure. Here, green stained CNTs emerged between red microtubules.
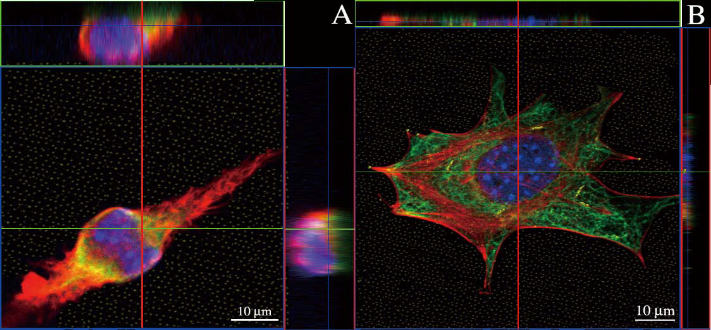
Figure 5. Confocal microscopy images of internalised CNTs of cells on nanostructured substrates; (A) cell grown on a nanostructured substrate with dot-dot distance of 73 nm. Actin filaments appear red, carbon tubes (yellow) are entangled closely with microtubules (green); (B) cell grown on a nanostructured substrate with dot-dot distance of 58 nm. Actin filaments are well dispersed and clearly visible. CNTs (yellow) entangled with microtubules (green). Nuclei are blue colour. Top and Right sides of each image are side views. The thickness of cell A is 8 times thicker than cell B.
3.5 Confirmation of internalised CNTs in flat cells by electron microscopy
For the sake of completeness, we confirmed that these CNTs were indeed internalised. We prepared a set of TEM and HRTEM images, shown collectively in Figure 6. For instance, Figure 6A shows a high magnification of three individual CNTs. There, the CNTs appear well separated, as single tube-like structures on the specimen’s holder. Figure 6B presents the rectangular area of Figure 6A under high resolution TEM. The multi-layer nature of multi-wall CNTs can be clearly seen here. There are 8 graphite sheets. We estimate individual graphite sheets to be 0.3 nm. The multi-layered wall of this CNT is about 20 nm wide. Figures 6G and 6F show an internalised CNTs. Figure 6F is a side view of the cell, whereas Figure 6G is a top view, horizontal section. The arrow points to a number of CNTs inside a vesicle. A staining contrast highlights the difference between cell membrane and cytoplasm. Figure 6D is a magnification of the rectangular area marked in Figure 6F. Here we see how internalised CNTs were deposited into individual membranes. Figure 6C is a magnification of the rectangular area in Figure 6D. Figure 6C shows a cross section of a multi-walled CNT inside a vesicle. The distinct dark area corresponds to the wall of a CNT with a hollow inner core, shown in moderate grey. Figure 6E shows a HRTEM image of the CNT’s wall, found in Figure 6C. The wall of this specific CNT is about 30 nm wide. A thicker CNT’s wall if compared to the one in Figure 6B.
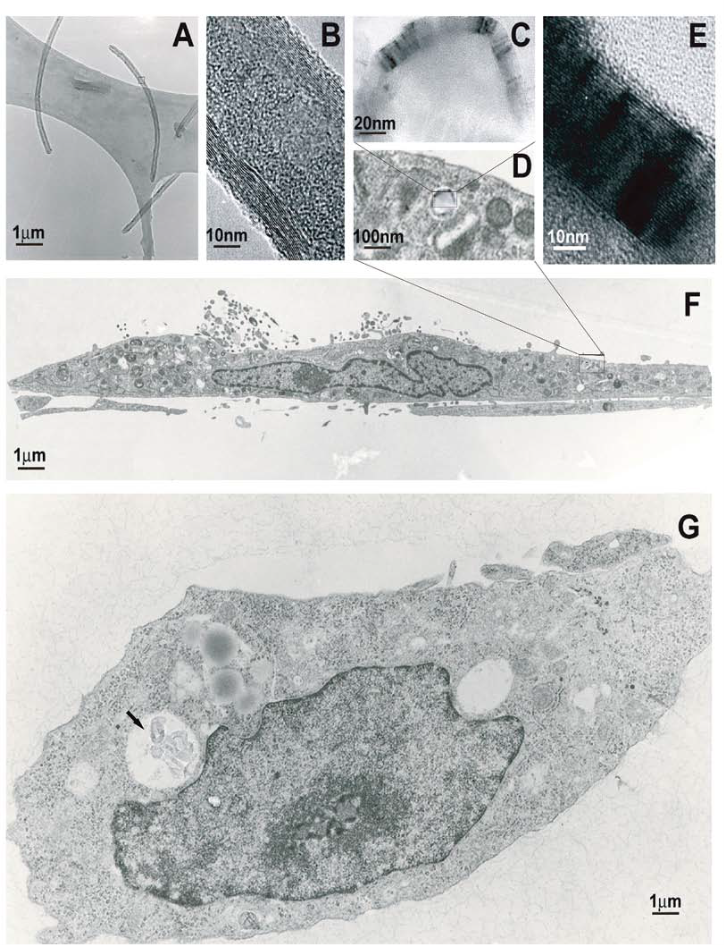
Figure 6. TEM images of flat cells containing CNTs; (A) Three individual CNTs; (B) the rectangular area in A under HRTEM; (C) a magnification of the rectangular area in D; (D) a magnification of the rectangular area in F; (E) a magnification on the multi-layered wall of a single CNT in C; (F) side view of the cell; (G) horizontal section of the cell.
4. Discussion
Fast and accurate imaging of internalised nanoparticles is still regarded as an open problem in nanomedicine and nanotoxicology. It is task often required but painfully performed. Although electron microscopy techniques are well-established and routinely employed, light microscopy ones are usually faster and demand easier sample preparations. A trade-off must be found. A main drawback of light microscopy techniques is the sample’s thickness, but it can be alleviated by treating the substrate as shown in this paper. By reducing the thickness, it is not necessary to take an ultrathin sectioning step; rather we can modify the sample for whole-cell imaging, keeping the sample intact. Confocal imaging for nanoparticles, here CNTs, is much improved. A definite advantage if a large amount of samples are processed. Many studies have visualised internalised CNTs by confocal microscopy, fluorescent microscopy and TEM [16-18]. However, it is generally difficult to image nanotubes when they are entangled with the cytoskeleton and actin filaments, or when they overlap [19]. Compare, for instance, the subcellular location of nanoparticles as seen through images like Figure 5A and 5B. The illustrative image in Figure 5B shows only a couple of CNTs, which can be seen only when the cell is wellspread. The accurate detection of CNTs from images as Figure 5A is rather cumbersome and prone to pitfalls [19]. As a by-product of reaching the maximum cell spreading, CNTs are actually oriented within the cells, which can pave the way for automatic counting of CNTs via image processing algorithms. The use of RGD peptides attached via thiol groups to gold dots provided specific bonds which are linked with integrin. By varying the spacing between gold nanoparticles, we can identify the critical distance between integrin ligands to promote cell adhesion. Maheshwari et al. employed a YGRGD peptide attached to the PEG hydrogel using a star-like PEO tether [20]. This approach allows the average surface density and local spatial distribution of RGD peptides to be controlled independently, in the range of approximately 50 nm [21]. In order to modify the RGD site density, different ratios of RGD and PEO need to be loaded on the substrate. RGD sites are randomly attached to the branches of starlike PEO tether, which makes it difficult to form a precise spacing of RGD nanopattern. The method here presented can create a precise nanopattern of gold dots; however, other nanostructured substrates are available in the literature [6,7]. The polymer we employ can control, at regularly-space intervals, the deposition of gold nanoparticles on glass substrates. Gold nanoparticles are heated up by hydrogen plasma and therefore fixed on the substrate. The size and concentration of micelles is the critical factor for the final distance between the nano gold dots. To keep this nanostructure-based approach more general, we show the distance between dots and not the concentration of micelles employed in the preparation. Other substrate preparations do exist, eg. [6,7], but a threshold mechanism in cell adhesion is universal. Here, fibroblast show a threshold in cell adhesion when nanodots are spaced in the range 60-70 nm. The increase in dot-dot separation beyond 58 nm causes a decrease in the number of dots (Figure 3, 4 and 5). There is a log-linear relationship between dot density and dotdot distance. Therefore, the observed limitation of cell adhesion at increased dot separation could be attributed to either a low number of gold dots covered with RGD peptides, or an increased local dot-dot distance. Either way, modulation of RGD distance dramatically influences cellular adhesion. Those cells on the 58 nm nanostructured substrates could form stress fibres and assembly focal adhesion points, while few cells on the 73 nm nanopattern succeeded (Figure 4). Cells adhered on nanostructured substrates with dot-dot distance of 58 nm show an average thickness of 1.78 ± 0.5 nm; whereas, when adhered on 73 nm we found an average thickness of 10 ± 2.1 nm. A phase contrast image, Figure 4, shows cells grown on nanostructured substrates. Even in this image modality, one can see the advantages of reduce cell’s thickness. For instance, the cell in Figure 5B, had reduced its thickness to about 1:8 with respect to the one in Figure 5A. It is intended that by reducing the cell’s thickness, cells and CNTs will rearrange to appear in a quasi-two dimensional projection. For the sake of completeness, we have confirmed the internalisation of these CNTs with TEM and HRTEM images (Figure 6). The nanoparticles are indeed internalised [19]. For example, Figure 6F and 6G show CNTs engulfed into individual membranes. In conclusion, herein we introduced a novel method for the preparation of nanostructured substrates with which cell’s thickness is reduced, and confocal microscopy of internalised CNTs is enhanced. Confocal microscopy with this method makes the sample preparation easier compared to electron microscopy. Our initial results are very encouraging; however, more work towards quantification and image processing software is required. Electron microscopy is not discouraged; but nevertheless, we think there are many potential untapped applications of light microscopy for fast, reliable and inexpensive visualisation of internalised nanoparticles.
Acknowledgements
CB’s work is partially supported by Chinese 973 Project (2010CB933901). FT’s work is partially supported by a grant from the German Research Foundation, DFG, under project TI-696/1-1.
References
Received 10 November, 2010; accepted 6 December, 2010; published online 16 December, 2010.
Copyright: (c) 2010 C. Bao, et al. This is an open-access article distributed under the terms of the Creative Commons Attribution License, which permits unrestricted use, distribution, and reproduction in any medium, provided the original author and source are credited.

|
Nano Biomedicine and Engineering. Copyright © Shanghai Jiao Tong University Press |
 |