![]()
Article
Image processing for the CCD based lateral flow strip detector
Xueqing Zhang, Hao Yang, Kan Wang*
Department of Bio-Nano-Science and Engineering, National Key Laboratory of Nano/Micro Fabrication Technology, Key Laboratory for Thin Film and Microfabrication of Ministry of Education, Institute of Micro-Nano Science and Technology, Shanghai JiaoTong University, 800 Dongchuan Road, Shanghai 200240, China
*Corresponding authors. Email: wk_xa@163.com
Abstract
The key of disease diagnosis by lateral flow strip is the acquirer of color signal data. We stablished a CCD based lateral flow strip detector. The detector is designed for the low density detection, and it is suitable for point-of-care diagnostics. We established the matched software and achieve basic functions. Through the image processing, like image filtering to reduce the random noise, gray-scale transformation and binarization to get the threshold of the color signal , edge detection to identify effective information , quantitative reading to give the result of diagnosis and so on. The sensitivity of this detector is sufficient for many parameters of clinical relevance.
Keywords: lateral flow strip; edge detection; noise reduce; quantitative reading;
Citation: X. Zhang, et al. Image processing for the CCD based lateral flow strip detector. Nano Biomed. Eng. 2010, 2(4), 214-217. DOI: 10.5101/nbe.v2i4.p214-217.
1. Introduction
Immunochromatography technology is developing rapidly since 1990s with the advantages of rapidness, simplicity, economy and single-test. Therefore, it has been used in medical test, quality monitor of food, poison detection, supervision of environment and so on. Today, immunochromatography is developed towards for the higher sensitivity, quantitative and multiplex detection, and may become the effective, sensitive, early screening and diagnostic mode for pathogens, malignant tumors and cardiovascular diseases, so on [1-8] . For the detection of the lateral flow strip, we designed a CCD based detector. We chose the LED circular light source, combined the CCD analog camera with the image capture card to gain the signals and shrinkage sharply the bulk of the biological immunochromatography analyzer, which laid the foundation of developing portable and accurate detector controlled by SCM. We established the matched software by Borland Delphi and achieve these functions as follows: image capture, image process, rapidly automatic diagnosis, the detective areas adjusting and report printing in time, as well as building a thorough patients’ information database to do some input, query and statistics about patients’ information. Herein we captured the strip images from different concentration grads of HCG, established the image processing to acquire the color signal to quantitative.
2. Image processing
2.1 Noise reduce
For the capture of images, there is noise that could not avoid, we called it random noise. To reduce the noise, we capture ten pictures once a time from the same strip, and we plus these pictures together. After the plus of each pixel, the image is clearer. Linear filtering to the image can reduce the noise of image. Since the low-continuity of many linear filtering, a large number of high-frequency information was lost while the remove of noise, and the graphics edge is blur, the image is not conducive to recognition of the edge. Median filter is a nonlinear method of removing noise, in many cases can only remove the noise and preserving edge. In this study, the relative concentration of information in a simple image, the median filter is a good choice and the early input noise can be well controlled. Median filter is used to get the average value of a neighborhood points to replace the points origin value of the digital image, where the value of Y is defined as follows:
A serials of numbers X1, X2, X3, X4, ..., Xn, if the order is as follows:
Xd ≤Xi2 ≤Xi3 ≤···≤Xin (1)
Then
Y = Med{ X1, X2, X3, ···,Xn} =Xi((n+1)/2) n is Odd (2)
Y = Med{ X1, X2, X3, ···,Xn} =[Xi(n/2)+Xi((n+1)/2]/2 n is Even
In one-dimensional case, median filter is an odd number of pixels of the sliding window, the value of the middle pixel is replaced by the median value of each pixel within the window. In the two-dimensional case, generally use the 3 × 3 or 5 × 5 window for median filtering. Although the median filter can remove the noise while preserving image edges, but the fuzzy outline of the target image is difficult to avoid, such as poor focus camera system, the signal narrow band transmission system and so on. In essence, the image blurring is due to high spatial frequency components are less than low spatial frequency components. To eliminate this type of vague, we must enhance the image of the high frequency components, namely, the image sharpening. Image sharpening is an easy way to improve the image quality. The edge of the image is composed of pixel points. Filtering for noise removal will be offset by the high-frequency enhancement for the whole image. Since the particularity require with the images in this article, based on the depth study of the sharpening principle, we use the edge detection algorithm detected the edge, and then only do the image high-frequency enhancement processing in the detected edge. Experimental results show that effectively solve the noise problem after image sharpening, shown in Figure 1.
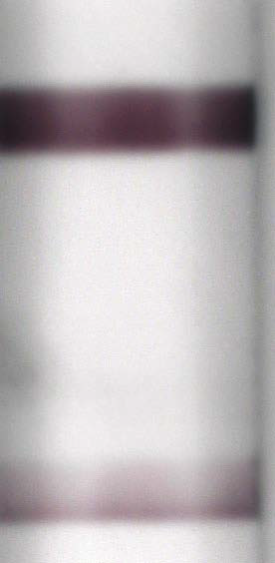
Figure 1. the strip image
2.2 Gray-scale transformation
Gray-scale transformation [9] is the most common image processing method, in the case of images with less information, gray-scale transformation to the image can directly give the main image information and ignore less important information. Since bitmap is lattice image, each pixel is composed by the Red (R), Green (G), Blue (B) components; RGB combinations can produce more than 1600 million colors. We repeated the test based on the actual situation, and finally using the following method: according to YUV color space, Y is the luminance component of the physical meaning, contains all the grayscale Information, so the Y component will be able to show a gray scale of the image. YUB and RGB have the following correspondence:

 (3)
(3)
Using the above formula, it can be calculated:
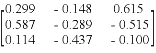
Y=0.299R+0.587G+0.114B (4)
According to R, G, B values we can calculated Y values, after the R, G, B values are converted to Y, we will be able to show the gray scale image, shown in Figure 2. Different in gray levels from the adjacent domain to enhance the edge of the signal, it should highlight the change of gray levels between adjacent points. Differential operation can calculate the rate of signal change, strengthen the role of high-frequency components, and make the image clean cut. Usually in the condition of unable to determine the contour orientation, we need to linear differential operator which do not have the space direction and rotation invariant, especially the convolution algorithm. Convolution is a good workaround to achieve sharpening, which can be seen as the weighted sum process. Convolution use the odd-dimensional matrix as a template, each pixel in region with the template, respectively, multiplied by the corresponding element, and that is the new regional center pixel value. We use a 3 × 3 template in the convolution, taking fully into account the border issues and cross-border issues. Histogram reflects the relationship between the grayscales and the probability in the image, so it can be treat as a discrete function:
P(Sk)=nk/n k=0, 1, 2 …, L-1 (5)
In the formula above, Sk is the k-level gray scale of image f(x,y), nk is the number of pixels of image f(x,y) which are in the gray value of Sk, and n is the total number of image pixels. Because P(Sk) shows the estimated probability of Sk, Histogram provides the distribution of the original gray value, that is an overall description of the image gray value. When we draw the histogram, generally reflect the 256 gray scales distribution with the x direction, and the y direction reflects the gray level on a number of pixels. The histogram is shown in Figure 3.
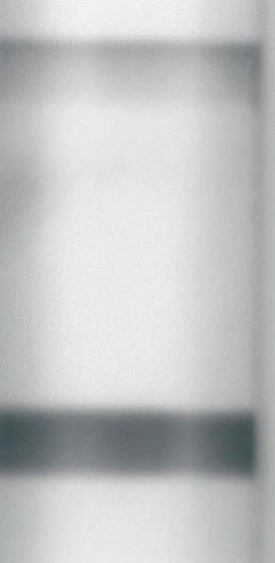
Figure 2. the gray image of the strip image
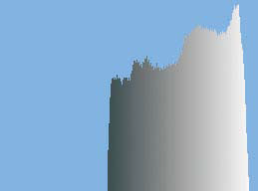
Figure 3. the histogram of the strip image
2.3 Edge detection
Usually before the contour extraction, we need to do some image processing about the details, to prevent the generation of false contours. The main methods are erosion and dilation, and the operation of structure open and structure close which are combination from erosion and dilation. The erosion of the binary image A by the structuring element B is defined by:
A ⊖ B ={ z ∈ E | B ≈ ⊆ A } (6)
Where Bz is the translation of B by the vector z, The dilation of A by the structuring element B is defined by:
A ⊕ B = ![]() (7)
(7)
The dilation is commutative, also given by:
A ⊕ B = B ⊕ A = ![]() (8)
(8)
The so-called contour extraction is to empty all of the internal point of the contour, retaining only edges. Specifically, when the original of the graphic is black, and there is a point that is the black point, while its eight neighboring points are the black point too we think this is an internal point of graphics that can be deleted.after this processing, we can get the contour from the image,shown in Figure 4.
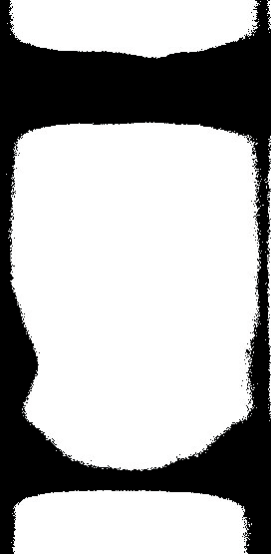
Figure 4. the couter of the strip image
2.4 Quantitative
When we get a clear outline, we can have a choice of effective information extraction. We calculated the average Gray value of the points that are inner the contour, and that is the final information we want. We have established the value of gray values and the corresponding relationship between the concentrations of HCG, shown in Figure 5. We prepared 13 concentrations of HCG, and capture the image of them, get the gray value, we find that the Logarithm of the concentration is linear with their gray value.
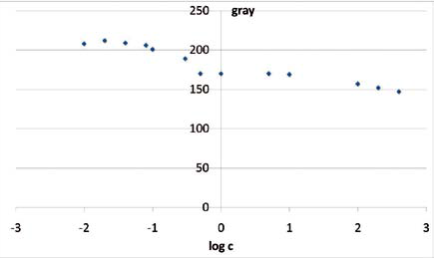
Figure 5. The relationship between gray values and HCG concentration
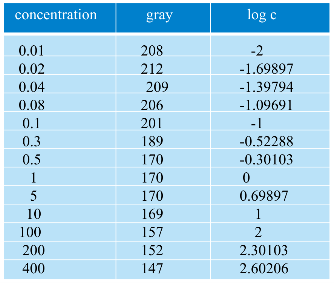
Table 1. the relationship between gray values and the concentrations of HCG
3. Conclusion
In this paper, after fully consider to the practical application necessary for a variety of conditions, we use self-developed CCD detector capture the strip image and get the quantitative information through a serials image processing. The relationship between gray value of strip and the concentration of HCG in the test sample is clinically significant.
Acknowledgements
This work was supported by the National Natural Science Foundation of China (No.20803040 and No.20471599), Chinese 973 Project (2010CB933901), 863 Key Project (2007AA022004), New Century Excellent Talent of Ministry of Education of China(NCET-08-0350), Special Infection Diseases Key Project of China (2009ZX10004-311), Shanghai Science and Technology Fund (10XD1406100, 1052nm04100 and No. 072112006-6).
References
1. Kurzbuch D, Bakker J, Melin J, Jonsson C, Ruckstuhl T, MacCraith BD, A biochip reader using super critical angle fluorescence.Sens. Actuators, B:Chem. 2009;137:1-6. doi:10.1016/j.snb.2008.12.057
2. Park K H, Lee S Q, Kim EK, Moon S E, Cho Y H, Gokarna A, et al. Bio-information scanning technology using an optical pickup head. Ultramicroscopy, 2008;108:1319-1324.doi:10.1016/ j.ultramic.2008.04.074
3. Perraut F, Lagrange A, Pouteau P, Peyssonneaux O, Puget P, McGall G, et al. A new generation of scanners for DNA chips. Biosens. Bioelectron. 2002;17:803-813. doi:10.1016/S0956- 5663(02)00073-8
4. Park SH, Ko KC, Choi MH. Choi, Novel and efficient detection of cAMP-dependent protein kinase for the development of a protein biochip. J. Labelled Compd. Radiopharm. 2009;52:422-426. doi:10.1002/jlcr.1621
5. Kurzbuch D, Bakker J, Melin J, Jonsson C, Ruckstuhl T, MacCraith BD, A biochip reader using super critical angle fluorescence. Sens. Actuators, B:Chem. 2009.137:1-6. doi:10.1016/j.snb.2008.12.057
6. Kurzbuch D, Bakker J, Melin J, Jonsson C, Ruckstuhl T, MacCraith BD. Biochip reader with dynamic holographic excitation and hyperspectral fluorescence detection. J. Biomed. Opt. 2007;12. doi:10.1117/1.2437143
7. Perraut F, Lagrange A, Poteau P, Peyssonneaux O, Puget P, McGall G, et al. A new generation of scanners for DNA chips. Biosens. Bioelectron. 2002.17:803-813. doi:10.1016/S0956- 5663(02)00073-8
8. Yang H, Guo Q, He R, Li D, Zhang X, Bao C, et al. A quick and parallel analytical method based on quantum dots labeling for ToRCH-related antibodies. Nanoscale Res. Lett. 2009;4:1469- 1474. doi:10.1007/s11671-009-9422-7
9. Alt P, Powell C, Owens B, Ifill H. A gray-scale addressing technique for thin-film-transistor/liquid crystal displays. IBM J. Res. Dev. 2010;36:11-22. doi:10.1147/rd.361.0011
Received 10 November, 2010; accepted 6 December, 2010; published online 16 December, 2010.
Copyright: (c) 2010 X. Zhang, et al. This is an open-access article distributed under the terms of the Creative Commons Attribution License, which permits unrestricted use, distribution, and reproduction in any medium, provided the original author and source are credited.

|
Nano Biomedicine and Engineering. Copyright © Shanghai Jiao Tong University Press |
 |