Low Concentration Platinum Nanoparticles Effectively Scavenge Reactive Oxygen Species in Rat Skeletal L6 Cells
Hidekazu Nakanishi1, Takeki Hamasaki2, Tomoya Kinjo1, Hanxu Yan1, Noboru Nakamichi2, Shigeru Kabayama3, Kiichiro Teruya1,2, Sanetaka Shirahata1,2*
1Division of Life Engineering, Graduate School of Systems Life Sciences, Kyushu University, 6-10-1 Hakozaki, Higashi-ku, Fukuoka 812-8581, Japan.
2Department of Bioscience and Biotechnology, Faculty of Agriculture, Kyushu University, Fukuoka 812-8581, Japan.
3Nihon Trim Co. Ltd., 1-8-34 Oyodonaka, Kita-ku, Osaka 531-0076, Japan.
*Corresponding author: Sanetaka Shirahata (sirahata@grt.kyushu-u.ac.jp) Tel/fax.: +81-92-642-3045/ +81-92-642-3052
Citation: H. Nakanishi, et al. Low Concentration Platinum Nanoparticles Effectively Scavenge Reactive Oxygen Species in Rat Skeletal L6 Cells. Nano Biomed. Eng. 2013, 5(2), 76-85.
DOI: 10.5101/nbe.v5i2.p76-85.
Prolonged exposure to excessive reactive oxygen species (ROS) increases risk factors for many diseases. Therefore, elimination of ROS as well as prevention of its production becomes critically important. In the present study, we evaluated the levels of cytotoxicity and ROS scavenging activity induced by synthetic platinum nanoparticles (PtNPs). Average size of synthesized PtNPs was 2.2nm.Synthetic PtNPs were found to scavenge both induced and endogenous H2O2 significantly in L6 rat skeletal muscle cells at a very low concentration (10-2 mg/l). To investigate the mechanism of action, the hierarchical oxidative stress model was used as an experimental model. To evaluate this possibility, we assessed glutathione concentration and gene levels of several antioxidant enzymes in PtNPs-treated (10−3-10 mg/l) L6 cells. Reduced glutathione (GSH) was increased in the range of 10−3-1 mg/l, but not in the 10 mg/l PtNP-treated cells. The GSH/GSSG ratio increased significantly at 1 mg/l and decreased in the 10 mg/l PtNP- treated cells. Most of the gene transcripts for oxidative stress inducible heme oxygenase-1 (HO-1), glutathione reductase (GR), copper-zinc superoxide dismutase (CuZn-SOD), manganese superoxide dismutase (Mn-SOD), glutathione peroxidase (GPx), and catalase were increased significantly by PtNPs at 10−1-10 mg/l. Such upregulatory effects induced by synthetic PtNPs at high concentrations (1-10 mg/l) in L6 cells can be explained by the hierarchical oxidative stress model. However, the cellular responses induced by low levels (10−3-10−2 mg/l) of PtNPs could not be fully explained by this model.
Keywords: Platinum nanoparticle; Reactive oxygen species; Oxidative stress; Antioxidant enzyme; Gene transcript
![]() Oxidative stress becomes apparent when reactive oxygen species (ROS) production exceeds the anti- oxidative defense systems inherent to the cell [1]. Prolonged oxidative stress leads to various diseases caused by damage to intracellular macromolecules, such as lipids, proteins, and DNA [2-5]. Three ways to circumvent or reduce oxidative stress have been suggested. These are to avoid the ROS generating environment (e.g., excessive exposure to ultraviolet radiation); enhance inherent antioxidative activity; and ingest antioxidants rich foodstuffs. In particular, utilization of antioxidants absorbed from foodstuffs is the most suitable way because of their easy availability and thus constitutes a rigorous research area. However, to facilitate a therapeutic effect in counteracting excess ROS, this approach faces the problem of low bioavailability of anti- oxidative ingredients despite ingesting large amounts of antioxidant-containing foods [6]. This is especially relevant in the brain because of the blood-brain barrier [7]. In contrast, accumulated antioxidants in the body are likely to be converted to prooxidants [8,9]. Therefore, the development of antioxidative agents that can efficiently control oxidative stress with limited consumption assure the maintenance of normal cellular homeostasis is highly anticipated. One such prospective agent is metal nanoparticles because of their characteristic properties including optical, electrical, and high catalytic activities.These properties are valuable to applications in electrical equipment, chemistry, physics, biology, and medical science. Noble metal nanoparticles (NPs) are especially attractive because of their biocompatibility, surface activity,antioxidative activity, and plasmon resonance effects [10,11]. Gold nanoparticles (AuNPs) and platinum nanoparticles (PtNPs) are considered the most important noble metal nanoparticles in the field of biomaterials. AuNPs have been suggested to suppress inflammatory responses in IL-6 human hepatocytic cells [12]. PtNPs have been suggested to act as a catalyst in in vitro reduction reactions and possess negative surface charges giving rise to an electric repulsion among charged particles allowing them to be stably suspended in solution [13]. Previously, we reported that synthetic PtNPs (2-3 nm) could significantly scavenge ROS, such as superoxide anion radical (O−), hydrogen peroxide (H2O2) and hydroxyl radical (OH·) in HeLa cells and in a hypoxanthine-xanthine oxidase system [14]. PtNPs are less cytotoxic because of their chemical stability and resistance to ionization compared with other metal nanoparticles [15,16]. A previous study has reported on the non-cytotoxic properties of PtNPs, of which 10−4- 103 ng/cm2 (7.86×10⁻⁷-7.86 mg/l) of 20-100 nm PtNPs affected neither cellular metabolism nor cell death [17]. However, the data supporting the safety and biological antioxidative activity of PtNPs remain limited; hence, confirming the safety aspects of nanoparticles are critically important for future applications. Although NPs at higher concentrations (3-400 mg/l) and larger sizes (5-100 nm) can cause oxidative stress leading to cytotoxicity, they also in certain conditions induce antioxidative enzymes responsible for cytoprotection [18- 21]. According to the hierarchical oxidative stress model, detoxification and antioxidative enzymes are induced via the NF-E2-related factor 2 (Nrf2)/antioxidant responsive element (ARE) pathway resulting from high oxidative stress conditions [22-24]. However, applicability of the model has not been tested on cellular responses induced by synthetic PtNPs. We used the L6 rat skeletal muscle cell system to further investigate the mechanisms of cytoprotective effects of PtNPs. In the present study, L6 cells were used because of their considerably high resting total glutathione level and related antioxidant enzymes [25]. Additionally, glutathione and other phase II detoxifying antioxidant enzymes regulated by the Nrf2/ARE pathway are activated by oxidative stress in endothelial and smooth muscle cells [26]. Moreover, NPs induce ROS to activate a pathway of MAPK-NFкB-Nrf2- ARE-phase II enzymes and antioxidant enzyme gene expression, and this pathway has been shown to operate as a defense mechanism [18,24,26-28]. Therefore, we aimed to evaluate whether the cellular responses induced by synthetic PtNPs were consistent with the hierarchical oxidative stress model with an emphasis on antioxidative enzyme gene expression.
Oxidative stress becomes apparent when reactive oxygen species (ROS) production exceeds the anti- oxidative defense systems inherent to the cell [1]. Prolonged oxidative stress leads to various diseases caused by damage to intracellular macromolecules, such as lipids, proteins, and DNA [2-5]. Three ways to circumvent or reduce oxidative stress have been suggested. These are to avoid the ROS generating environment (e.g., excessive exposure to ultraviolet radiation); enhance inherent antioxidative activity; and ingest antioxidants rich foodstuffs. In particular, utilization of antioxidants absorbed from foodstuffs is the most suitable way because of their easy availability and thus constitutes a rigorous research area. However, to facilitate a therapeutic effect in counteracting excess ROS, this approach faces the problem of low bioavailability of anti- oxidative ingredients despite ingesting large amounts of antioxidant-containing foods [6]. This is especially relevant in the brain because of the blood-brain barrier [7]. In contrast, accumulated antioxidants in the body are likely to be converted to prooxidants [8,9]. Therefore, the development of antioxidative agents that can efficiently control oxidative stress with limited consumption assure the maintenance of normal cellular homeostasis is highly anticipated. One such prospective agent is metal nanoparticles because of their characteristic properties including optical, electrical, and high catalytic activities.These properties are valuable to applications in electrical equipment, chemistry, physics, biology, and medical science. Noble metal nanoparticles (NPs) are especially attractive because of their biocompatibility, surface activity,antioxidative activity, and plasmon resonance effects [10,11]. Gold nanoparticles (AuNPs) and platinum nanoparticles (PtNPs) are considered the most important noble metal nanoparticles in the field of biomaterials. AuNPs have been suggested to suppress inflammatory responses in IL-6 human hepatocytic cells [12]. PtNPs have been suggested to act as a catalyst in in vitro reduction reactions and possess negative surface charges giving rise to an electric repulsion among charged particles allowing them to be stably suspended in solution [13]. Previously, we reported that synthetic PtNPs (2-3 nm) could significantly scavenge ROS, such as superoxide anion radical (O−), hydrogen peroxide (H2O2) and hydroxyl radical (OH·) in HeLa cells and in a hypoxanthine-xanthine oxidase system [14]. PtNPs are less cytotoxic because of their chemical stability and resistance to ionization compared with other metal nanoparticles [15,16]. A previous study has reported on the non-cytotoxic properties of PtNPs, of which 10−4- 103 ng/cm2 (7.86×10⁻⁷-7.86 mg/l) of 20-100 nm PtNPs affected neither cellular metabolism nor cell death [17]. However, the data supporting the safety and biological antioxidative activity of PtNPs remain limited; hence, confirming the safety aspects of nanoparticles are critically important for future applications. Although NPs at higher concentrations (3-400 mg/l) and larger sizes (5-100 nm) can cause oxidative stress leading to cytotoxicity, they also in certain conditions induce antioxidative enzymes responsible for cytoprotection [18- 21]. According to the hierarchical oxidative stress model, detoxification and antioxidative enzymes are induced via the NF-E2-related factor 2 (Nrf2)/antioxidant responsive element (ARE) pathway resulting from high oxidative stress conditions [22-24]. However, applicability of the model has not been tested on cellular responses induced by synthetic PtNPs. We used the L6 rat skeletal muscle cell system to further investigate the mechanisms of cytoprotective effects of PtNPs. In the present study, L6 cells were used because of their considerably high resting total glutathione level and related antioxidant enzymes [25]. Additionally, glutathione and other phase II detoxifying antioxidant enzymes regulated by the Nrf2/ARE pathway are activated by oxidative stress in endothelial and smooth muscle cells [26]. Moreover, NPs induce ROS to activate a pathway of MAPK-NFкB-Nrf2- ARE-phase II enzymes and antioxidant enzyme gene expression, and this pathway has been shown to operate as a defense mechanism [18,24,26-28]. Therefore, we aimed to evaluate whether the cellular responses induced by synthetic PtNPs were consistent with the hierarchical oxidative stress model with an emphasis on antioxidative enzyme gene expression.
Hydrogen hexachloroplatinate (H2PtCl6), L-buthionine S, R-sulfoximine (BSO), bis-chloroethylnitrosourea (BCNU), L-glutathione reduced (GSH), ethylene-diaminetetraacetic acid (EDTA) and N-acetyl-L-cysteine (NAC) were purchased from Sigma-Aldrich Japan (Tokyo, Japan). 2-(4-Iodophenyl)-3-(4-nitrophenyl)-3-(2,4- disulfophenyl)-2H-tetrazolium monosodium salt (WST-1), 1-methoxy PMS and Cell Stain Hoechst 33342 solution were purchased from Dojindo Laboratories (Kumamoto, Japan). Hydrogen peroxide, Bes-H2O2-AC, 5-fluoroorotic acid DMSO solution, polyoxyethylene 20 sorbitan mono- laurate (Tween 20), oxidized L-glutathione (GSSG), o-phthalaldehyde (OPA), and N-ethylmaleimide (NEM) were purchased from Wako Pure Chemical Inc. (Tokyo, Japan). Amberlite EG-4-HG was purchased from Organo Corp. (Tokyo, Japan). Thunderbird SYBR qPCR Mix was purchased from Toyobo (Osaka, Japan). 3H-1,2-dithiole- 3-thione (D3T) was obtained from LKT Laboratories, Inc. (St. Paul, MN, USA). Sterile plastic dishes (90 mm and 60 mm) and culture plates (12-well and 96-well) were purchased from Greiner Bio-One Co., Ltd (Tokyo, Japan). Dulbecco’s modified Eagle medium (DMEM) was from Nissui Pharmaceutical Co., Ltd. (Tokyo, Japan). Fetal bovine serum (FBS) was from Invitrogen Japan (Tokyo, Japan). Penicillin and streptomycin were obtained from Meiji Holdings Co., Ltd (Tokyo, Japan). All solutions were prepared with deionized water produced by a Milli-Q synthesis system (Milli-Q water, Merck Millipore, Tokyo, Japan). All other chemicals were of analytical reagent grade and obtained from Wako Pure Chemical Inc. (Tokyo, Japan).
Strong reducing reagents, such as hydrazine mono- hydrate, and sodium tetrahydroborate, are usually used to prepare metal nanoparticles. Some of these reagents are toxic to living organisms when they are nanoparticle con- taminants. From this point of view, citrate and ethanol are often used to prepare noble metal nanoparticles for biological applications. Therefore, we selected sodium citrate as a reducing reagent because of its safety, low cost, and ability to serve as a stabilizer during preparation [29,30]. PtNPs were synthesized by a modified citrate reduction method of H2PtCl6 as described before [14,31]. In brief, the solution containing the appropriate platinum complex (in a concentration equivalent to 2.62 g hydrogen hexachloroplatinate in 1000 ml water) was brought to its boiling point, and 5 ml of 20 wt% sodium citrate was added. The solution was then refluxed for 6 h, during which time samples were taken to determine changes of absorbance at 600 nm using a spectrophotometer (UV-2450, Shimadzu, Kyoto, Japan). The reaction was considered complete when the absorbance reached a constant value. The solutions were demineralized by an Amberlite EG-4-HG ion-exchange resin. The concentration of PtNPs was determined by inductively coupled plasma mass spectrometry (ICP-MS, Agilent 7500, Agilent Technologies, CA, USA) at the Center for Advanced Instrumental Analysis, Kyushu University. The concentration of the synthesized PtNPs was adjusted to 100 mg/l and stored at 4°C. The sizes of the PtNPs were analyzed by transmission electron microscopy (TEM; JEM 2000 FX, JEOL, Tokyo, Japan), and the sizes for PtNPs in the photograph were determined using freely available ImageJ 1.41 software downloaded at imagej.nih. gov/ij/download/.
L6 rat skeletal muscle cells obtained from American Type Culture Collection (ATCC, Manassas, VA, USA) were cultured in DMEM supplemented with 10% FBS, 100 units/ml penicillin, and 100 μg/ml streptomycin in 10 mm culture dishes at 37°C in a humidified atmosphere with 5% CO2. Undifferentiated myoblast cells were used in the present study.
Effects of PtNPs on L6 cells were evaluated by WST-1 assay kit following the manufacturer’s instructions. L6 cells were seeded in 96-well plates at a density of 5.0×10³ cells/well in 100 μl culture medium and incubated in a humidified atmosphere with 5% CO2 at 37°C for 24 h. Culture medium was then aspirated, and the wells were washed twice with PBS buffer. Each well was filled with 100 μl medium containing PtNPs at concentrations of 0-10 mg/l and incubated for 24 h. As a negative control group, three wells were filled with cells in DMEM medium without PtNPs. After a 2 h cultivation, the wells were washed twice with PBS buffer, and 100 μl DMEM with WST-1 (500 μM) and PMS (20 μM) were added. After a1 h incubation, absorbance of each well was measured at 450 nm using a microplate reader (Tecan Group Ltd., Männedorf, Switzerland).
LDH leakage was measured using a LDH Kit (Wako Pure Chemical Inc., Tokyo, Japan) closely following the manufacturer’s instructions. Briefly, L6 cells were seeded in 96-well plates at a density of 5.0×10³ cells/well in 50 μl culture medium and incubated in a humidified atmosphere with 5% CO2 at 37°C for 24 h. Several concentrations of PtNPs were then added to each well and incubated at 37°C for 2 h. For the positive control, cells were incubated with medium containing 0.1% (w/v) Tween 20 and the resulting LDH level released was set as 100%. Released LDH was measured at 595 nm, and relative LDH release is defined as the ratio of released LDH by PtNPs compared with that of Tween 20. Less than 10% LDH release compares to Tween 20 was regarded as non- toxic to L6 cells based on the criterion [32].
L6 cells were seeded in 96-well plate at a density of 5.0×10³ cells/well in 100 μl culture medium and incubated at 37°C for 24 h. Subsequently, culture medium was washed twice with PBS and replaced by 100 μl medium containing PtNPs at 0-10 mg/l and incubated for 2 h. After a 2 h exposure, the wells were washed twice with PBS and incubated with 100μl 5μMBes-H2O2-AC for 30 min and 10 μl 1 μM Hoechst 33342 for 15 min. The relative fluorescence intensity of Bes-H2O2-AC indicating intracellular H2O2 was determined by IN Cell Analyzer 1000 (GE Healthcare, Tokyo, Japan) with an excitation at 480 nm and an emission at 535 nm. To count the cell number, Hoechst 33342 was used for nuclei staining, and fluorescence was measured with an excitation at 352 nm and an emission at 461 nm.
Cellular GSH contents were measured by a modified method that is specific for the determination of GSH at pH 8.0 [33,34]. In brief, L6 cells were seeded in 12-well plates at a density of 1.0×10⁵ cells/well in 1 ml culture medium and incubated at 37°C for 24 h. Afterward, culture medium was washed twice with PBS and replaced by 1 ml of PtNP-containing medium at 0-10 mg/l and incubated for 2 h. After a 2 h exposure, the wells were washed twice with PBS buffer, and cells were suspended in DMEM. A cell suspension was centrifuged at 250×g for 5 min. The cell pellets were washed with PBS buffer. To the cell pellet, 2 μl 25% metaphosphoric acid and 4 μl 400 mM sodium phosphatase buffer containing 5 mM EDTA at pH 8.0 were added, and the cells were homogenized by ultrasonication on ice. After homogenization, the samples were centrifuged at 13,000×g for 30 min. The supernatant was diluted 10-fold with PBS, and 5 μl of the diluted sample was incubated with 10 μl of o-phthaldialdehyde (0.1% in methanol) and 137 μl phosphatase buffer for 15 min at room temperature. Fluorescence was read in a fluorescence spectrometer (F- 2500, Hitachi, Japan) at an excitation wavelength of 350 nm and emission wavelength of 420 nm. Cellular GSH content was expressed as nmol GSH/mg cellular protein. Cellular protein was analyzed by the BCA method using a Microplate BCATM assay kit (Thermo Scientific, Ill, USA). The supernatant obtained for GSH measurement as above mentioned was treated with 1 μl 100 mM NEM for 30 min at room temperature to prevent the oxidation of GSH to GSSG, and cellular GSSG contents were measured at pH 12.0 because the conversion of GSH to GSSG was negligible [33]. The absorbance and emission spectra for the OPT-GSSG reaction were equivalent to that of GSH.
Total RNA was isolated from variously treated L6 cells using a High Pure RNA Isolation Kit (Roche Diagnostics, Tokyo, Japan) following the manufacturer’s instructions. Complementary DNA (cDNA) was synthesized using a ReverTra Ace qPCR RT Kit (Toyobo, Osaka, Japan) following the manufacturer’s protocol. qRT-PCR was performed using Thunderbird SYBR qPCR Mix (Toyobo, Osaka, Japan) and a Thermal Cycler Dice Real-Time System TP-800 (Takara Bio Inc., Shiga, Japan). PCR amplification began with 10 s denaturation step at 95°C and then 40 cycles of denaturation at 95°C for 5 s, annealing at 55°C for 20 s, and extension at 72°C for 20 s. The samples were analyzed in triplicate, and the expression levels of each gene target were normalized to the corresponding glyceraldehyde-3-phosphate dehydrogenase (GAPDH) level. The PCR primer sequ- ences are listed in Table 1.
Table 1 List of PCR primers.
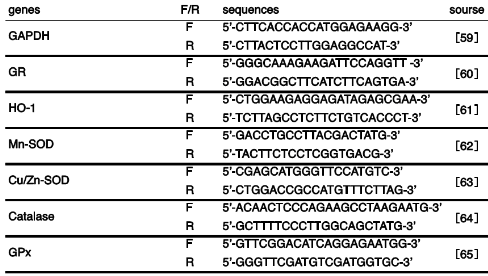
Abbreviations: Forward (F), Reverse (R), glyceraldehyde-3-phosphate dehydrogenase(GAPDH), Glutathione Reductase (GR), Heme oxygenase 1 (HO-1), manganese superoxide dismutase (Mn-SOD), copper-zinc superoxide dismutase (Cu/Zn-SOD), glutathione peroxidase (GPx).
Three independent replicates were conducted for all experiments. Data are presented as the mean ± standard deviation (SD) of three independent experiments. Statis- tical significance was determined by two-tailed Student’s t-test, and p value of <0.05 was considered significant.
The sizes of the synthetic PtNPs were measured by TEM. Particle sizes within a designated size range from 0.5 to 4.0 nm in 0.5 nm increments revealed a distribution shown in Fig.1b.From these data,the mean size of the synthetic PtNPs was determined to be 2.2 nm, which was advantageous because smaller NPs should be more efficiently taken up by the cells [35].
The toxic effects of metal nanoparticles have been well studied (14,17,36-39). Because of these undesirable effects, the cytotoxicity of the presently synthesized 2.2 nm PtNPs should be evaluated prior to their use in biological applications. Therefore, we measured the cyto- toxicity of the 2.2 nm PtNPs. The WST-1 assay was selected to assess the modula- tion of cellular mitochondrial activity. L6 cells were treated with various concentrations of PtNPs. PtNP concentrations between 10−3 to 10 mg/l did not exhibit any cytotoxic effect compared with the untreated control (Fig. 2a). Additionally, we used H2O2 as a positive control. Cell viability was reduced to approximately 80% with 200 μM and 40% with 400 μM H2O2, respectively (##p<0.01, Fig. 2a). PtNPs are freely dispersed in solution and may affect cells via contact with and attachment to the cell surface, which can cause membrane injury. To assess this possibility, we used the LDH assay system because the loss of intracellular LDH and its release into culture medium is an indicator of irreversible cell death due to cell membrane damage. L6 cells were treated as described with various concentrations of PtNPs. PtNP concentrations between 10−3 to 10 mg/l did not exhibit significant LDH release (<8%) (Fig. 2b), although the release of LDH did tend to increase as the PtNP concentration approached 10 mg/l. In this assay system, we used Tween 20 as the positive control, and the released LDH was set to 100%. For the interpretation of these results, we adopted the criterion used in a previous report whereby PtNPs are defined as non-toxic to the cell when released LDH is less than 10% of the control value [32]. PtNPs at less than 10 mg/l concentration did not exhibit any cytotoxic effect on L6 cells (Fig. 2b). Present results support previous findings that 2-3 nm synthetic PtNPs up to 50 mg/l are non-toxic to normal and cancer cell lines [14]; 10 mg/l of 5 to 8 nm PtNPs did not reduce the cell viability of either the human embryonic lung cell line (IMR-90) or the human glioma cell line (U251) [36]. PtNPs are regarded as less cytotoxic compared with other NPs in part because of their low ionization tendency. PtNPs have been shown to have no adverse effect on cell growth even at relatively higher concentrations (10-50 mg/l) [14]. Because of these characteristics, little cytotoxicity should be induced by PtNPs at concentrations less than 10 mg/l.
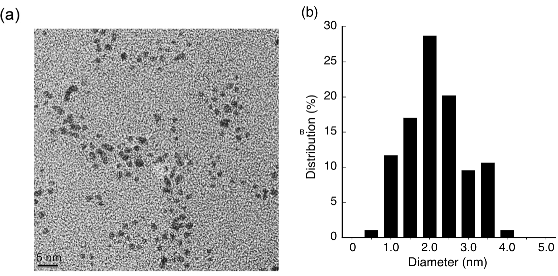
Fig. 1 (a) TEM image of PtNPs. (b) Ninety-four PtNPs were randomly chosen from the images to determine average particle sizes as the basis for the size distribution graph.

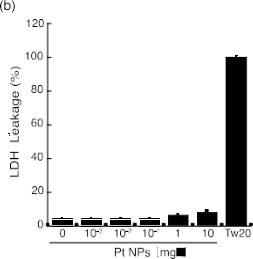
Fig. 2 Cytotoxicity assays for the synthetic PtNPs. (a) Viable cells were determined using the WST-1 assay kit after incubating L6 cells with the medium containing 10% FBS and various concentrations of PtNPs for 24 h. Pound marks denote significant difference from the untreated control cells (##P<0.01). (b) LDH leakage was measured using an LDH assay kit after incubating L6 cells with various concentrations of PtNPs for 2 h.
The majority of NPs cause cytotoxicity by oxidative stress [37,38]. We observed that the PtNPs used in the present study had a tendency to show slight LDH leakage at 10 mg/l (Fig. 2). In addition, cytotoxicity was indu- ced by PtNP concentrations greater than 20 mg/l, and pronounced cytotoxicity was induced by concentrations greater than 100 mg/l [36]. Such cytotoxicity induced by high PtNP concentrations may be caused by physical injury of the cell [39] and cytotoxic effects via partially ionized PtNPs [17,38]. Although cytotoxicity caused by most of the NPs is accompanied by increased ROS levels, PtNPs are an exceptional material because they do not increase ROS levels [36,40,41]. To evaluate the correlation between cytotoxicity as above observed and intracellular ROS levels, we performed a ROS scavenging assay using synthetic PtNPs. To investigate the effect of PtNPs on L6 cells, the relative amount of intracellular H2O2 was measured with a Bes-H2O2-AC fluorescent probe. This probe is designed to specifically detect intracellular H2O2, and its specificity is superior to that of the commonly used 2′,7′-dichlorodihydrofluorescein diacetate [42]. PtNPs at six concentrations (0, 10−3, 10−2 , 10−1 , 1, and 10 mg/l) were exposed to L6 cells for 2 h, and intracellular ROS levels were measured using an IN Cell Analyzer. The relative fluorescence intensities of PtNP-treated L6 cells decreased significantly in a dose-dependent manner with a PtNP concentration range between 10−2 to 1 mg/l (## p<0.01, Fig. 3a). Surprisingly, PtNPs at a very low concentration (10−2 mg/l) exhibited significant intracellular ROS scavenging activity, and ROS scavenging activity was observed even at 10−3 mg/l. To more thoroughly examine the scavenging ability of PtNPs, we used menadione to induce the ROS, especially H2O2, and evaluated the ROS scavenging activity of 10−2 mg/l PtNPs under excess ROS conditions. As shown in Fig. 3b, the Bes-H 2O2 -AC fluorescent probe level without these three components was set to 100% and designated as the absolute control. The relative fluorescence level incubated with DMSO (control experiment) alone increased significantly to 150% ( ** p<0.01) compared with that of the absolute control. The relative fluorescence level incubated with DMSO and menadione increased significantly to 240% ( ** p<0.01) and this was designated as the positive control. From the positive control, the relative fluorescence level significantly decreased to 55% with the addition of 10−2 mg/l PtNPs ( ## p<0.01). NAC alone with or without the other two components decreased endogenous H2O2 level significantly compared with that of the absolute ( ## p<0.01) and positive ( ## p< 0.01) controls. These controls confirmed that this assay performed properly. Under these conditions, 10−2 mg/l PtNPs was found to scavenge intracellularly induced H2O2. PtNPs at higher concentrations (10−1 -10 mg/l) and even at a very low concentration (10−2 mg/l) were confirmed to scavenge endogenous as well as induced intracellular H2O2 significantly. Intracellular ROS levels are thought to result from a primary response to internalized nanoparticles leading to decreased cell viability [43]. Thus, the suppression of excess ROS is of prime importance for cell survival. In this regard, our data suggested that PtNPs scavenge ROS in a dose-dependent manner from 10−3 to 10 mg/l in L6 cells. Notably, a very low level (10−2 mg/l) of PtNPs could significantly scavenge ROS. Although a strong O2− but not H2O2 scavenging ability of PtNPs has been reported, the concentration used was 2 mg/l (10 μM), and they did not examine concentrations less than 2 mg/l [41]. To our best knowledge, there is no report similar to our present study that demonstrates ROS scavenging activity at these low concentrations. The mechanisms of intracellular ROS scavenging activity of PtNPs are unclear. Similar to inducing antioxidative enzymes, PtNPs are proposed to scavenge ROS directly or indirectly. Therefore, we performed additional experiments to determine the mechanism of ROS scavenging activity.
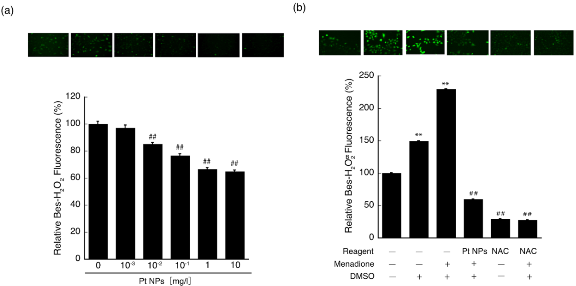
Fig. 3 ROS scavenging ability of PtNPs. (a) Scavenging effect of PtNPs on intracellular intrinsic H2O2. The fluorescence intensity of Bes- H2O2-AC was indicative of the intracellular intrinsic H2O2 level per cell and determined by an IN Cell Analyzer. Pound marks denote significant difference from the untreated control cells (##P<0.01). Representative photographs of Bes-H O -AC detected fluorescent cells are shown above the graph, and the photograph on the left corresponds to the control bar at 0 mg/l PtNPs in the graph. The other photographs correspond to bars at 10−3 to 10 mg/l PtNPs. (b) ROS scavenging ability of PtNPs pretreated with menadione. Each reaction cocktail shown under the graph was denoted by “+” for the addition of DMSO, menadione, PtNPs or NAC, and “–” denotes the lack of these components. Asterisks represent significant differences of the DMSO with or without menadione-treated cells compared with the untreated control cells (all “–”, **P<0.01). Pound marks represent significant differences of the fluorescence intensities of menadione/DMSO/PtNP- or NAC-treated cells from that of the menadione/DMSO-treated cells (##P<0.01). Representative photographs of Bes-HO-AC detected fluorescent cells are shown above the graph, and the photograph on the left corresponds to the control bar in the graph without additives. The other photographs correspond to the bars with each treatment.
In an effort to identify the relevant ROS scavenging mechanism, we considered whether the hierarchical oxidative stress model is applicable to cellular responses following PtNP treatment [22,23]. The model is based on the 4-zones of oxidative stress levels residing between high GSH/GSSG ratio (low oxidative stress) and low GSH/GSSG ratio (high oxidative stress). Thus, in cells at a normal oxidant state, ROS are produced minimally in the mitochondria, which are readily neutralized by cellular defense systems, such as GSH and antioxidant enzymes. In the next zone, termed Tier 1 with a slightly increased oxidative stress level, cells respond to induce detoxification enzymes, such as heme oxygenases, and antioxidative enzymes, such as glutathione reductase, glutathione peroxidase, superoxide dismutase, catalase, and others via the Nrf2-ARE pathway. Incidentally, a higher oxidative stress zone, termed Tier 2, is believed to induce an inflammatory response activating NF-κB and MAPK signaling pathways. The highest oxidative stress zone, termed Tire 3, causes cytotoxicity via mitochondrial perturbation [22-24]. Cellular responses to various NPs follow the hierarchical oxidative stress model [18]. Thus, PtNPs synthesized in the present study are anticipated to exert an effect in accordance with this model and may induce antioxidative defense systems in L6 cells. To determine whether PtNPs affect cellular GSH level, L6 cells were treated with increasing concentrations of PtNPs (0, 10-3, 10-2, 10-1, 1 and 10 mg/l), D3T, BSO and BCNU for 2 h followed by the measurement of intracellular GSH concentrations as described in the Materials and Methods section. DMSO, D3T, BCNU, and BSO were used as controls. The cells treated with these reagents exhibited GSH responses as expected. Therefore, increased GSH levels obtained after PtNP treatment are considered significant results. Fig. 4a demonstrates that GSH levels in the 10−3, 10−2, 10−1 and 1 mg/l PtNP-treated L6 cells increased significantly without concentration dependency compared with that of the untreated control cells (**p<0.01). Such elevated GSH levels are expected to act on ROS directly, thereby protecting the cells from oxidative stress [44,45]. The level of intracellular GSH induced by 10 mg/l was similar to that of the control cells. As shown in Fig. 4b, GSSG levels were also measured using cell extracts that were prepared for GSH measurement. The GSSG levels of L6 cells treated with 10−3 to 1 mg/l PtNPs could not detect a significant effect compared with that of the untreated control cells. However, the GSSG levels of 10 mg/l PtNP- treated L6 cells increased significantly compared with that of the untreated control cells (*p<0.05). DMSO and BSO treatment slightly reduced GSSG levels, whereas D3T slightly elevated GSSG levels. BCNU treatment, in contrast, increased GSSG levels significantly (*p<0.05). Using the data for GSH and GSSG, we calculated the GSH/GSSG ratio as shown in Fig. 4c. As a result, the GSH/GSSG ratio was found to increase significantly in the 1 mg/l PtNP-treated cells and decreased significantly at 10 mg/l. Because we observed that LDH leakage was slightly increased in the LDH leakage assay, oxidative stress was assumed to be induced at 10 mg/l PtNP. Because of this stress, increased GSH levels induced by PtNPs were converted through an oxidization reaction to increased GSSG levels and consequently reduced the GSH/GSSG ratio. In contrast, relative oxidative stress induced by PtNP concentrations below 1 mg/l is considered too weak to consume intrinsic GSH, thereby the GSH level is increased. This assumption appears to agree with the stress levels between Tier 1 and Tier 2 in the hierarchical oxidative stress model. However, the consistent reduction of intracellular ROS caused by PtNP concentrations from 10−3 mg/l to 10 mg/l would suggest an alternative mechanism that is different from the hierarchical oxidative stress model.
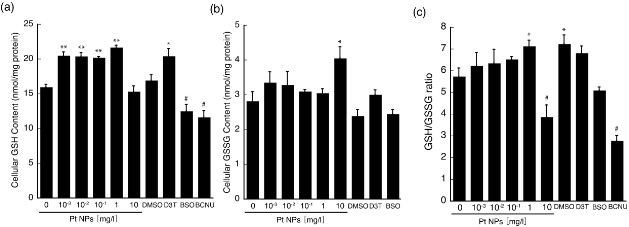
Fig. 4 Measurements of cellular GSH and GSSG content in L6 cells. (a) Cellular GSH content was determined by a published method [33] and expressed as nmol GSH/mg protein in which cellular protein content was determined by the BCA method. (b) Cellular GSSG content was masked by NEM and determined by a published method [33]. (c) GSH/GSSG ratios were determined using data obtained in (a) and (b). Asterisks and pound signs denote significant differences from the untreated control cells (*P<0.05, **P<0.01, #P<0.05).
To evaluate our hypothesis, we determined anti- oxidative enzyme gene expression levels. We performed a series of qRT-PCR measurements by first evaluating GR transcript levels. L6 cells were treated for 2 h with increasing concentrations of PtNPs (0, 10−3, 10−2, 10−1, 1, and 10 mg/l). mRNA levels were determined, and the gene expression levels of antioxidative enzyme- related genes were investigated by RT-PCR. As shown in Fig. 5a, GR transcript levels were slightly increased when treated at 10−3 to 10−2 mg/l. In particular, 1 mg/ l and 10 mg/l of PtNP-treated cells increased 3.1- and 3.5-fold, respectively. Likewise, we evaluated other antioxidative enzyme gene expression levels. HO- 1, the marker for cellular oxidative stress [26,46,47], transcript levels increased significantly at 10−1 and 10 mg/l (*p<0.05), whereas HO-1 transcript levels of 1 mg/l PtNP-treated cells increased 1.68-fold compared with that of the untreated cells (**p<0.01,Fig.5b).Mitochondrial enzyme, Mn-SOD transcript levels were increased in a concentration-dependent manner from 10−1 to 10 mg/l (Fig. 5c). Cytosolic enzyme CuZn-SOD transcript levels were not induced in a concentration-dependent manner, although a statistical analysis indicated that mRNA levels of cells treated with 10−1 to 10 mg/l of PtNPs increased significantly compared with that of the untreated control cells (**p<0.01 for 1 mg/l; *p<0.05 for 10−1 and 10 mg/ l; Fig. 5d). Catalase transcript levels were increased significantly at 10−1 and 1 mg/l of PtNPs (**p<0.01 for 10−1 mg/l; *p<0.05 for 1 mg/l) (Fig. 5e). GPx transcript levels also increased significantly at 1 and 10 mg/l PtNP-treated cells (*p<0.05 for 1 mg/l; **p<0.01 for 10 mg/l; Fig. 5f). Expression levels of most of the antioxidative genes were increased significantly at concentrations between 10−1 and 10 mg/l PtNPs. Considering that the cytotoxic effect observed at 10 mg/l PtNPs and a reduction of the GSH/ GSSG ratio, the hierarchical oxidative stress model does explain the effect of PtNPs in the range of 10−1 to 10 mg/l. In this model, a lower amount of oxidative stress induces antioxidant enzymes by the antioxidant responsive element (ARE) activated by Nrf2. Involvement of the Nrf2/ARE pathway for anti-oxidant enzyme production by oxidative stress has been supported by various studies [18,24,27,28]. On the other hand, PtNPs treatment at concentrations of 10−3 mg/l and 10−2 mg/l resulted in significant up- regulations of gene expressions for GR and Mn-SOD. However, for example, ZnO NPs at 20 mg/l caused weak cytotoxicity while several antioxidant enzyme activities and GSH levels were up-regulated. However, when the NP concentration was reduced to 10 mg/l, such regulatory effects were no longer observed [48]. Other group also reported similar conclusion by using TiO2 NPs [49]. These reports suggest that decrease of NP concentration in a very narrow range results in no change in the antioxidative gene expressions and GSH levels. We reduced PtNPs concentrations to 1/1,000 and 1/10,000 of 10 mg/l, yet the reduction of intracellular ROS and increased GSH level were observed. Therefore, the cellular responses at these extremely low concentrations of PtNPs are less likely to be explained by the hierarchical oxidative stress model. We observed an increased tendency of LDH leakage in response to increasing PtNP concentrations (up to 10 mg/l), decreased the GSH/GSSG ratio at 10 mg/l, and upregulation of antioxidative enzyme gene expression at 1 mg/l and 10 mg/l PtNPs accompanied with strong ROS scavenging activity. Other reports supporting the hierarchical oxidative stress model have not demonstrated the correlation that NPs induce intracellular ROS to initiate the activation of antioxidative enzyme gene expression. The model implicates a subsequent ROS scavenging by these enzymes. However, we have not found any report associating upregulation of antioxidative enzyme gene expression with ROS scavenging activity by NPs. Therefore, the reduction of intracellular ROS is assumed the result of direct ROS scavenging activity by PtNPs at 1 mg/l and 10 mg/l based on an in vitro study [14]. Although direct ROS scavenging by PtNPs at 10−2 or 10−3 mg/l is an attractive possibility, it is less likely because the PtNP concentrations are too low. Our group and others have reported that NPs including PtNPs are internalized via pinocytosis, diffusion, and other processes [14,16,17,36]. According to reports, internalized PtNPs are estimated to be approximately 8,000 particles per cell when using 2 nm PtNPs at 10 mg/l; this demonstrates strong ROS scavenging activity when these PtNPs are added to the cells. By simple calculation, the internalized PtNPs will be 8 particles per cell when 10−3 mg/l PtNPs is added to the cells [14,50]. Therefore, it is unlikely that such a small number of internalized PtNPs could directly exert strong ROS scavenging ability in the present study. Taken together, the cellular responses at these extremely low concentrations of PtNPs would suggest alter- native mechanisms that are different from the hierarchical oxidation stress model. Intracellular redox regulation systems are very complicated and not fully understood [51]. From our results, one of possible pathways activated by PtNPs at low concentration may be directly or indirectly involved in the GR activation pathway rendering the activation of GSH up-regulatory pathway. However, pro- tein synthesis and enzyme activities are remained to be investigated because the increments of GSH amount, and of GR and Mn-SOD transcript levels by PtNPs treat- ment were not large and did not show prominent dose dependencies. Another possible pathway is to activate the thioredoxin system, which regulates intracellular redox status through the cascade distinct from either the Nrf2-ARE pathway or the GSH/GSSG system [52]. Protein disulfide isomerase, part of a superfamily referred to as the thioredoxin superfamily, regulates the ratio of sulfhydryl residue in many redox-sensitive proteins such as ER oxidoreduction family proteins [53]. It has been known that carbon particles and PM2.5 activate epidermal growth factor receptor and stimulate signal cascades [18,54]. Similarly, AuNPs inhibit I kappa B kinase (IKK) activity by modifying Cys-179 of IKKβ, which is a subunit of IKK kinase complex [55]. As stated above, nanoparticles will participate not only in the induction of oxidative stress but also in the activation of signal cascades to scavenge ROS in cells. Taken together, PtNPs may modulate ROS scavenging systems independent of Nrf2-ARE pathway by binding to redox related receptors and/or proteins. We have studied the antioxidant effects of PtNPs on multicellular organisms, which will provide fundamental information leading to understanding their safety and antioxidant efficacy. It has been reported that the lifespan of C. elegans was extended by the SOD/catalase mimetic activities of PtNPs [56]. Moreover, electrochemically reduced water and synthetic PtNPs at ppb concentrations have been shown to scavenge ROS induced by paraquat in the nematode and significantly extend its lifespan [57,58]. Notably, levels of PtNPs contained in electrochemically reduced water, which is safe and approved for human consumption, have resulted in an extension of C. elegans lifespan [58]. Present results together with previously published data indicate that PtNPs could exert a critical role in maintaining intercellular redox homeostasis and are expected to be a new type antioxidant distinctively different from existing antioxidants.
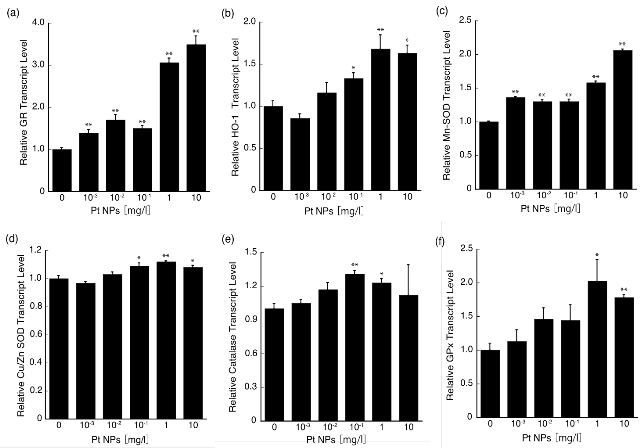
Fig. 5 Effect of PtNPs on levels of mRNAs coding for antioxidative proteins measured by qRT-PCR. L6 cells were seeded in a 60-mm dish at a density of 1.0×10⁵ cells/well and incubated for 24 h. Culture medium was replaced with 5 ml of medium containing PtNPs at concentrations of 0-10 mg/l. After the 2 h incubation, the cells were used to prepare total RNA for RT-PCR analysis. PCR primer sequences for each target gene are shown in Table 1. The results are displayed as fold induction relative to the control and normalized against GAPDH expression. Asterisks denote significant (*P<0.05, **P<0.01) difference from the untreated control cells.
Our results with synthesized PtNPs by the sodium citrate reduction method yielded an average size of 2.2 nm and were found to be non-toxic to L6 rat skeletal muscle cells based on cell viability and LDH release assays. Moreover, we found that a very low PtNP concentration (i.e., 10−2 mg/l) scavenged both induced and intrinsic ROS in L6 cells. In the present study, we aimed to clarify the mechanisms involved in this ROS scavenging effect using the hierarchical oxidative stress model as an experimental model. We found that the results obtained from the 10−3-10 mg/l PtNP treatments were in agreement with the hierarchical oxidative stress model. However, the model does not fully explain the ROS scavenging mechanism at 10−2 mg/l PtNPs and implies an alternative ROS scavenging mechanism.
Copyright:(c) 2013 H. Nakanishi et al. This is an open-access article distributed under the terms of the Creative Commons Attribution License, which permits unrestricted use, distribution, and reproduction in any medium, provided the original author and source are credited.

|
Nano Biomedicine and Engineering. Copyright © Shanghai Jiao Tong University Press |
 |