Article
A Step-by-Step Optimization Process to Fabricate Narrow Sized Dual Drug Loaded Polymeric Nanoparticles Using Modified Nanoprecipitation Technique
Moorthi Chidambaram *, Kathiresan Krishnasamy
Department of Pharmacy, Annamalai University, Annamalai Nagar - 608 002, Chidambaram, Tamil Nadu, India.
* Corresponding author: Moorthi Chidambaram (cmoorthitgodu@gmail.com)
Citation: M. Chidambaram and K. Krishnasamy. A Step-by-Step Optimization Process to Fabricate Narrow Sized Dual Drug Loaded Polymeric Nanoparticles Using Modified Nanoprecipitation Technique. Nano Biomed. Eng. 2013, 5(3), 107-115.
DOI: 10.5101/nbe.v5i3.p107-115.
The primary aim of the study was to prepare narrow sized polymeric nanoparticles by implementing few modifications to the conventional nanoprecipitation technique and to evaluate the effect of various process parameters on prepared polymeric nanoparticles. Eudragit E 100 nanoparticles were prepared by modified nanoprecipitation technique and step-by-step optimization was carried out to evaluate the effect of various process parameters such as organic solvent, polymer concentration, percentage of organic solvent, mode of addition of organic solvent in to aqueous phase, volume of aqueous phase, poloxamer 188 concentration, β-cyclodextrin concentration, temperature generated during sonication process, sonication duration, and drug concentration on the particle size, surface area, distribution width and uniformity of the prepared nanoparticles. The optimized process parameters were implemented to fabricate dual drug loaded Eudragit E 100 nanoparticles which were spherical in shape with mean particle size in the range of 118 to 140 nm, polydispersity index in the range of 0.187 to 0.254 and zeta potential in the range of 16.6 to 28.8 mV. Thus developed modified nanoprecipitation method can be used to fabricate narrow sized polymeric nanoparticles.
Keywords: Dual drug loaded polymeric nanoparticles, Eudragit E 100, Modified nanoprecipitation method, Step-by-step optimization
Nanotechnology literally means engineering particles on a near atomic scale with at least one dimension between 1-100 nanometer (nm). Size reduction in nano range significantly enhances the surface area and reactivity, which modify the physicochemical properties of the size reduced compound. Hence, nanotechnology is being implemented in more than a dozen field of science including medicine. Particularly, nanotechnology is being implemented in the treatment of various diseases through nanoparticulate drug delivery system, as it provides several advantages over conventional drug delivery system. Nanoparticulate drug delivery system includes but not limited to solid-lipid nanoparticles, lipid nanoparticles, gold nanoparticles, silver nanoparticles, carbon nanotubes, nanocrystals, mesoporous silica nanoparticles, nanosponges, metallic nanoparticles, magnetic nanoparticles, albumin nanoparticles, fullerene nanoparticles and polymeric nanoparticles [1-4]. Each nanoparticulate drug delivery system has its own advantages and disadvantages. However, polymeric nanoparticles offers some potential advantages, which includes (a) Enhancement of aqueous solubility of hydrophobic drug; (b) Protection of encapsulated drug from degradation; (c) Improvement in the bio-distribution and circulation time of the drug; (d) Provides control and sustain release of the drug; (e) Increases the intercellular concentration of drug by enhanced permeability and retention effect; (f) Reduces the number of required dose; (g) Provides an opportunity to incorporate both hydrophilic and hydrophobic drugs in a single polymeric matrix; (h) Feasibility of administration through various route including oral, nasal, parenteral, intraocular etc.; and (i) Reduces the systemic toxicities of the drug by encapsulation and targeting the drug to specific site [5-7]. Polymeric nanoparticles can be prepared by solvent evaporation method, salting-out method, nanoprecipitation method, nano spray drying method, dialysis method, desolvation method, supercritical fluid technology and ionic gelation method. However, nanoprecipitation is the most convenient and commonly used method for the preparation of polymeric nanoparticles but yield particles with broad distribution leading to difficulty in establishing the conclusion on which sized particles are responsible for the biological effects [6,8-16]. Hence, the primary aim of the study was to prepare narrow sized polymeric nanoparticles by implementing few modifications to the conventional nanoprecipitation method and to evaluate the effect of various process parameters on prepared polymeric nanoparticles using step-by-step optimization process.
Eudragit E 100 (Degussa, India) was used as a polymer. Analytical grade ethanol (Brampton, Canada) and acetone (S.D Fine Chemicals, India) were used as organic solvent. β-cyclodextrin (β-CD, Himedia Laboratories, India) was used as stabilizer. Poloxamer 188 (Sigma-Aldrich, India) was used as surfactant. Curcumin (97%, Sigma-Aldrich, India), Piperine (97%, Sigma-Aldrich, India), Quercetin (98%, Sigma-Aldrich, India) and Silibinin (≥98%, Sigma- Aldrich, India) were used as model drugs.
Eudragit E 100 nanoparticles were prepared by nanprecipitation technique [17-19] with slight modification. Briefly, polymer was dissolved in organic solvent, which was transferred in to distilled water under sonication (40 kHz, Lark, India). Nanoparticles were formed instantaneously and turned the aqueous phase slightly milky with bluish opalescence. Sonication process was used to aid the size reduction and to evaporate residual organic solvent from the nanoformulation. The mean particle size, surface area, span (i.e. distribution width) and uniformity of the prepared nanoparticles depends on process parameter such as organic solvent, polymer concentration, percentage of organic solvent, mode of addition of organic phase in to aqueous phase, the volume of aqueous phase, poloxamer 188 concentration, β-CD concentration, temperature generated during sonication process, sonication duration, and drug concentration. Hence, step-by-step optimization was carried out to evaluate the effect of these process parameters on prepared Eudragit E 100 nanoparticles.
Briefly, 125 mg Eudragit E 100 was dissolved in 10 mL various organic solvent (i.e. ethanol and acetone), which was transferred at once in to 20 mL distilled water under sonication (40 kHz, Lark, India) for 60 minutes to form colloidal nanosuspension, which was used for further characterization. The optimized batch with optimized solvent was carried forward for subsequent optimization.
Briefly, various concentration of Eudragit E 100 (i.e. 50, 125, 250 and 500 mg) was dissolved in 10 mL of ethanol, which was transferred at once in to 20 mL of distilled water under sonication (40 kHz, Lark, India) for 60 minutes to form colloidal nanosuspension, which was used for further characterization. The optimized batch with optimized polymer concentration was carried forward for subsequent optimization.
Briefly, 250 mg Eudragit E 100 was dissolved in 10 mL various percentage of ethanol (i.e. 100%, 90%, 80%, 70%, 60%, and 50%), which was transferred at once in to 20 mL of distilled water under sonication (40 kHz, Lark, India) for 60 minutes to form colloidal nanosuspension, which was used for further characterization. The optimized batch with optimized percentage of ethanol was carried forward for subsequent optimization.
Briefly, 250 mg Eudragit E 100 was dissolved in 10 mL of 60% ethanol, which was transferred through various mode (i.e. added at once or injected at the rate of 2 mL per minute through 0.3 × 8mm needle and 0.55 × 25 mm needle) in to 20 mL distilled water under sonication (40 kHz, Lark, India) for 60 minutes to form colloidal nanosuspension, which was used for further characterization. The optimized batch with optimized mode of addition of organic phase was carried forward for subsequent optimization.
Briefly, 250 mg Eudragit E 100 was dissolved in 10 mL of 60% ethanol, which was transferred at once in to various volume of distilled water (i.e. 15, 20, 25 and 30 mL) under sonication (40 kHz, Lark, India) for 60 minutes to form colloidal nanosuspension, which was used for further characterization. The optimized batch with optimized volume of aqueous phase was carried forward for subsequent optimization.
Briefly, 250 mg Eudragit E 100 was dissolved in 10 mL of 60% of ethanol, which was transferred at once in to 20 mL of distilled water containing various concentrations of Poloxamer 188 (i.e. 50, 125, 250 and 500 mg) under sonication (40 kHz, Lark, India) for 60 minutes to form colloidal nanosuspension, which was used for further characterization. The optimized batch with optimized Poloxamer 188 concentration was carried forward for subsequent optimization.
Briefly, 250 mg Eudragit E 100 was dissolved in 10 mL of 60% ethanol, which was transferred at once in to 20 mL of distilled water containing 125 mg of Poloxamer 188 and various concentration of β-CD (i.e. 50, 125, 250 and 500 mg) under sonication (40 kHz, Lark, India) for 60 minutes to form colloidal nanosuspension, which was used for further characterization. The optimized batch with optimized β-CD concentration was carried forward for subsequent optimization.
Briefly, 250 mg Eudragit E 100 was dissolved in 10 mL of 60% ethanol, which was transferred at once in to 20 mL distilled water containing 125 mg Poloxamer 188 and 50 mg β-CD under sonication (40 kHz, Lark, India) for 60 minutes to form colloidal nanosuspension. However, water in the sonicator was replaced with fresh water (i.e. every 15 minutes and every 5 minutes). Prepared nanoformulation was used for further characterization and optimized batch with optimized duration to change the water in the sonicator was carried forward for subsequent optimization.
Briefly, 250 mg Eudragit E 100 was dissolved in 10 mL of 60% ethanol, which was transferred at once in to 20 mL of distilled water containing 125 mg Poloxamer 188 and 50 mg β-CD under sonication (40 kHz, Lark, India) for various duration (i.e. 60 minutes, 45 minutes and 30 minutes) to form colloidal nanosuspension. However, water in the sonicator was replaced with fresh water every 5 minutes. Prepared nanoformulation was used for further characterization and optimized batch with optimized sonication duration was carried forward for subsequent optimization.
Briefly, 250 mg Eudragit E 100, various concentration of curcumin (i.e. 5, 12.5, 25 and 50 mg) were dissolved in 10 mL of 60% of ethanol, which was transferred at once in to 20 mL of distilled water containing 125 mg of Poloxamer 188 and 50 mg β-CD under sonication (40 kHz, Lark, India) for 60 minutes to form colloidal nanosuspension. However, water in the sonicator was replaced with fresh water every 5 minutes. Prepared nanoformulation was used for further characterization and optimized batch was used for fabrication of dual drug loaded Eudragit E 100 nanoparticles.
Prepared Eudragit E 100 nanoparticles were characterized for distribution width (D10, D50, and D90), mean particle size, surface area, span, and uniformity using Mastersizer (Mastersizer 2000 Version 5.54, Malvern Instruments Ltd., UK). Briefly, prepared nanosuspension was added drop-wise in to the distilled water maintained in the sample dispersion unit operated with a shaft pump and stirrer to disperse the nanoparticles continuously around the measurement zone.
Characterization results were expressed as mean ± standard deviation (SD) and student t test (GraphPad Prism software; version 5.04) was used to evaluate the significance of difference. The differences were considered significant if P value <0.05 and non-significant if P value >0.05.
Briefly, 250 mg Eudragit E 100 with and without 50 mg various dual drug combinations [i.e. (25 mg curcumin + 25 mg piperine); (25 mg curcumin + 25 mg quercetin); and (25 mg curcumin + 25 mg silibinin)] were dissolved in 10 mL of 60% ethanol, which was transferred at once in to 20 mL distilled water containing 125 mg Poloxamer 188 and 50 mg β-CD under sonication (40 kHz, Lark, India) for 60 minutes to form colloidal nanosuspension. However, water in the sonicator was replaced with fresh water every 5 minutes. Prepared plain and dual drug loaded Eudragit E 100 nanoparticles were characterized for mean particle size, polydispersity index (i.e. uniformity), and zeta potential using Zetasizer (ZEN3600, Malvern Instrument, UK). Particle surface morphology of plain and dual drug loaded Eudragit E 100 nanoparticles were examined using transmission electron microscopy (Hitachi H-7500).
3 Results and Discussion
Eudragit E 100 nanoparticles were prepared using modified nanoprecipitation method. During preparation, addition of organic phase containing polymer in to the aqueous phase results in rapid miscibility of organic solvent in to aqueous phase leading to increase in the polarity of organic solvent, which in turn decreases the solubility of Eudragit E 100. Nucleation of Eudragit E 100 gets initiated when the equilibrium concentration surpasses the solubility threshold of Eudragit E 100. However, sonication process inhibits the nucleation of Eudragit E 100 at the initial stage but the cationic nature of polymer provides higher zeta potential to the formed Eudragit E 100 nanoparticles and develops an electrostatic force and keeps the nanoparticles in Brownian motion, which inhibits the further growth of Eudragit E 100 particles resulting in the formation colloidal nanoformulation. Brownian motion of Eudragit E 100 nanoparticles overcomes the Van der Waals force of attraction and gravitational force resulting in the prevention of Eudragit E 100 nanoparticle aggregation and sedimentation [6,20]. Prepared Eudragit E 100 nanoparticles were characterized for particle size, surface area and span, as these parameters decides the performance of prepared nanoparticles including solubility, dissolution, drug release, cellular uptake, circulation half-life, and bio-distribution. Uniformity of the prepared nanoparticles is the most significant parameter that decides the consistency of performance. uniformity value<0.3 shows narrow distribution and >0.5 shows broad distribution and leads to difficulty in establishing the conclusion on which sized particles are responsible for the biological effects [6].
3.1 Effect of various organic solvent on Eudragit E 100 nanoparticles
To study the effect of solvent’s polarity on Eudragit E 100 nanoparticles, we have used ethanol (Relative polarity: 0.654) and acetone (Relative polarity: 0.355). The optimization results (Table 1) has shown that the solvent’s polarity has significant (P<0.05) effect on the mean particle size, span, uniformity. Out of two formulations, EF01 containing ethanol as organic solvent has shown the least mean particle size and uniformity (Fig. 1), which was carried forward for the subsequent optimization.
3.2 Effect of polymer concentration on Eudragit E 100 nanoparticles
Eudragit E 100 is a cationic polymer which provides cationic surface and prevents the aggregation of nano- particles. To study the effect of polymer concentration on nanoparticles, we have used 50, 125, 250 and 500 mg of Eudragit E 100. The optimization results (Table 2) has shown that 50 mg polymer was not detectable by the instrument. However, increase in polymer concentration has shown significant (P<0.05) increase in the mean particle size, span and uniformity, which might be due to forced accommodation of polymer in the limited space available at the aqueous phase. Out of three formulations, EF01 containing 125 mg Eudragit E 100 has shown least mean particle size, span, uniformity and higher specific surface area but the standard deviation of these parameters in EF01 are far higher, whereas increase in polymer concentration from 125 mg has shown negligible standard deviation in the characterization parameters. Formulation EF04 containing 250 mg Eudragit E 100 was the next least mean particle size, span and uniformity (Fig. 2), which was carried forward for the subsequent optimization.
3.3 Effect of various percentage of ethanol on Eudragit E 100 nanoparticles
Ethanol with 0.654 relative polarity has produced least mean particle size and uniformity than acetone with 0.355 relative polarity, which shows increase in relative polarity decreases the mean particle size. To further study the effect of ethanol polarity on Eudragit E 100 nanoparticles, we have used 100%, 90%, 80%, 70%, 60% and 50% of ethanol. The optimization results (Table 3) has shown that the decrease in percentage of ethanol up to 60% significantly (P<0.05) decreases the distribution width, mean particle size, span, uniformity. Out of six formulations, EF09 containing 60% ethanol has shown the least mean particle size, span, and uniformity (Fig. 3), which was carried forward for the subsequent optimization.
Table 1. Effect of various organic solvent on Eudragit E 100 nanoparticles
|
Code |
Organic Solvent |
Distribution Width (nm) |
MPS (nm) |
|
Span |
Uniformity |
||
|
D 10 |
D 50 |
D 90 |
||||||
|
EF01 |
Ethanol |
71±3.5 |
126±3.0 |
230±1.0 |
167±2.5 |
51.6±1.9 |
1.260±0.060 |
0.604±0.021 |
|
EF02 |
Acetone |
79±0.6 |
114±1.5 |
189±2.0* |
172±1.5* |
53.3±0.6 |
0.994±0.001* |
0.716±0.006* |
MPS: Mean Particle Size; SA: Surface Area;
*P<0.05 as compared to EF01
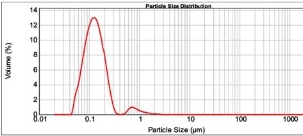
Figure 1: Characterization spectrum of formulation EF01.
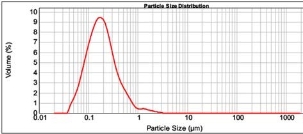
Figure 2: Characterization spectrum of formulation EF04.
Table 2. Effect of polymer concentration on Eudragit E 100 nanoparticles
|
Code |
EE100 (mg) |
Distribution Width (nm) |
MPS (nm) |
SA (m² g−1) |
Span |
Uniformity |
||
|
D10 |
D 50 |
D 90 |
||||||
|
EF03 |
50 |
Not detectable |
||||||
|
EF01 |
125 |
71±3.5 |
126±3.0 |
230±1.0 |
167±2.5 |
51.6±1.9 |
1.260±0.060 |
0.604±0.021 |
|
EF04 |
250 |
79±0.0 |
176±0.0 |
450±0.6* |
242±0.0* |
41.0±0.0* |
2.100±0.002* |
0.728±0.001* |
|
EF05 |
500 |
134±0.6 |
343±0.6 |
917±0.6*# |
462±0.6*# |
22.8±0.1*# |
2.279±0.003*# |
0.745±0.001*# |
MPS: Mean Particle Size; SA: Surface Area; EE100: Eudragit E 100; EF01: Optimized batch from pervious trial;
*P<0.05 as compared to EF01;
#P<0.05 as compared to EF04.
To study the effect of addition mode of organic phase on Eudragit E 100 nanoparticles, we have transferred the organic phase through various modes (i.e. at once and injected at the rate of 2 mL per minute through 3 × 8mm needle and 0.55 × 25 mm needle). The optimization results (Table 4) has shown that injection of organic phase has significantly (P<0.05) increases the distribution width (D 90), mean particle size, span, and uniformity, which might be due injection of organic phase through needle allowing the organic phase to expand in the atmospheric air, where ethanol gets evaporated resulting in precipitation of polymer before it reaches the aqueous phase. Out of three formulations, EF09 with addition of organic phase at once has shown the least mean particle size, span, uniformity and higher surface area, which was carried forward for the subsequent optimization.
3.5 Effect of various volume of aqueous phase on Eudragit E 100 nanoparticles
To study the effect of volume of aqueous phase on Eudragit E 100 nanoparticles, we have used 15, 20, 25 and 30 ml. The optimization results (Table 5) has shown significant (P<0.05) effect on distribution width (D 90), mean particle size, span, and uniformity. Out of four formulations, EF09 with 20 mL of aqueous phase has shown least mean particle size, distribution width, span, uniformity and higher surface area, which was carried forward for the subsequent optimization.
3.6 Effect of Poloxamer 188 concentration on Eudragit E 100 nanoparticles
Addition of Poloxamer 188 results in penetration of hydrophobic (polypropylene, polypropylene oxide) chain which can bind to the hydrophobic cavities of Eudragit E 100 during the nanoprecipitation process and the hydrophilic (polyethylene glycol, polyethylene oxide) chain provides additional hydrophilicity and stability to the nanoparticles [21]. To study the effect of Poloxamer 188 concentration on Eudragit E 100 nanoparticles, we have used 50,125, 250 and 500 mg. The optimization results (Table 6) has shown that the addition of Poloxamer 188 at and above 250 mg has significantly (P<0.05) increases the distribution width (D 90), mean particle size, span, and uniformity. Out of four formulations, EF17 125 mg of Poloxamer 188 has shown least mean particle size, distribution width, span, uniformity and higher surface area, which was carried forward for the subsequent optimization.
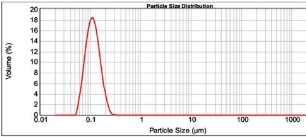
Figure 3: Characterization spectrum of formulation EF09.
Table 3. Effect of various percentage of ethanol on Eudragit E 100 nanoparticles
|
Code |
Ethanol (%) |
Distribution Width (nm) |
MPS (nm) |
SA (m² g−1) |
Span |
Uniformity |
||
|
D 10 |
D 50 |
D 90 |
||||||
|
EF04 |
100 |
79±0.0 |
176±0.0 |
450±0.6 |
242±0.0 |
41.0±0.0 |
2.100±0.002 |
0.728±0.001 |
|
EF06 |
90 |
81±0.0 |
189±0.6 |
447±0.0* |
231±0.6* |
39.5±0.1* |
1.943±0.004* |
0.599±0.002* |
|
EF07 |
80 |
64±0.0 |
120±0.0 |
216±0.0* |
131±0.0* |
58.2±0.0* |
1.270±0.000* |
0.395±0.000* |
|
EF08 |
70 |
71±0.0 |
127±0.0 |
216±0.6* |
136±0.0* |
52.9±0.1* |
1.144±0.005* |
0.355±0.001* |
|
EF09 |
60 |
75±0.0 |
112±0.0 |
169±0.0* |
118±0.0* |
55.8±0.0* |
0.836±0.000* |
0.260±0.000* |
|
EF10 |
50 |
172±0.6 |
440±0.0 |
1186±0.0* |
576±0.6* |
17.3±0.0* |
2.306±0.001* |
0.711±0.000* |
MPS: Mean Particle Size; SA: Surface Area; EF04: Optimized batch from pervious trial;
*P<0.05 as compared to EF04
Table 4. Effect of various injection mode on Eudragit E 100 nanoparticles
|
Code |
Addition Mode |
Distribution Width (nm) |
MPS (nm) |
SA (m² g−1) |
Span |
Uniformity |
||
|
D 10 |
D 50 |
D 90 |
||||||
|
EF09 |
At once |
75±0.0 |
112±0.0 |
169±0.0 |
118±0.0 |
55.8±0.0 |
0.836±0.000 |
0.260±0.000 |
|
EF11 |
LSN |
73±5.5 |
133±3.5 |
227±0.6* |
146±7.0* |
51.0±3.0 |
1.157±0.071* |
0.383±0.003* |
|
EF12 |
SSN |
67±2.0 |
117±1.0 |
214±1.0* |
263±114.5 |
55.7±1.5 |
1.259±0.038* |
1.519±0.961 |
MPS: Mean Particle Size; SA: Surface Area; LSN: Large Sized Needle (0.55x25 mm); SSN: Small Sized Needle (0.3x8mm); EF09: Optimized batch from pervious trial;
*P<0.05 as compared to EF09
Table 5. Effect of various volume of aqueous phase on Eudragit E 100 nanoparticles
|
Code |
Aqueous Phase (mL) |
Distribution Width (nm) |
MPS (nm) |
SA (m² g−1) |
Span |
Uniformity |
||
|
D 10 |
D 50 |
D 90 |
||||||
|
EF13 |
15 |
66±0.0 |
129±0.0 |
248±0.0* |
150±0.0* |
54.4±0.0* |
1.414±0.000* |
0.485±0.000* |
|
EF09 |
20 |
75±0.0 |
112±0.0 |
169±0.0 |
118±0.0 |
55.8±0.0 |
0.836±0.000 |
0.260±0.000 |
|
EF14 |
25 |
80±0.0 |
126±0.0 |
194±0.0* |
132±0.0* |
50.6±0.0* |
0.901±0.000* |
0.283±0.000* |
|
EF15 |
30 |
79±0.0 |
119±0.0 |
179±0.0* |
125±0.0* |
52.7±0.0* |
0.837±0.000* |
0.262±0.000* |
MPS: Mean Particle Size; SA: Surface Area; EF09: Optimized batch from pervious trial;
*P<0.05 as compared to EF09.
3.7 Effect of β-CD concentration on Eudragit E100 nanoparticles
Addition of β-CD improves the stability of drugs that are encapsulated in the Eudragit E 100 nanoparticles. To study the effect of β-CD concentration on Eudragit E 100 nanoparticles, we have used 50, 125, 250 and 500 mg. The optimization results (Table 7) has shown that the addition of β-CD significantly (P<0.05) increases the distribution width (D 90), mean particle size, span, and uniformity. Out of four formulations, EF20 with 50 mg β-CD has shown least mean particle size, distribution width and higher surface area (Fig. 4), which was carried forward for the subsequent optimization.
3.8 Effect of temperature generated during sonication on Eudragit E 100 nanoparticles
To study the effect of temperature that generate during sonication process on Eudragit E 100 nanoparticles, we have changed the water in the sonicator every 15 minutes and every 5 minutes. The optimization results (Table 8) has shown change of water in the sonicator significantly (P<0.05) decreases the distribution width (D 90), mean particle size, span and increases the surface area. Out of three formulations, EF25 with change of water every 5 minutes has shown least distribution width (D 90), mean particle size, span, and higher surface area (Fig. 5), which was carried forward for the subsequent optimization.
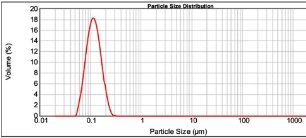
Figure 4: Characterization spectrum of formulation EF20.

Figure 5: Characterization spectrum of formulation EF25.
Table 6. Effect of poloxamer 188 concentration on Eudragit E 100 nanoparticles
|
Code |
Poloxamer 188 (mg) |
Distribution Width (nm) |
MPS (nm) |
SA (m² g−1) |
Span |
Uniformity |
||
|
D 10 |
D 50 |
D 90 |
||||||
|
EF09 |
0 |
75±0.0 |
112±0.0 |
169±0.0 |
118±0.0 |
55.8±0.0 |
0.836±0.000 |
0.260±0.000 |
|
EF16 |
50 |
75±0.0 |
112±0.0 |
169±0.0 |
118±0.0 |
55.7±0.0 |
0.835±0.000 |
0.260±0.000 |
|
EF17 |
125 |
75±0.0 |
112±0.0 |
169±0.0 |
118±0.0 |
55.9±0.0 |
0.835±0.000 |
0.260±0.000 |
|
EF18 |
250 |
80±0.0 |
121±0.0 |
181±0.0* |
126±0.0* |
52.3±0.0* |
0.840±0.000* |
0.264±0.000* |
|
EF19 |
500 |
76±0.0 |
124±0.0 |
198±0.0* |
131±0.0* |
52.0±0.0* |
0.983±0.000* |
0.307±0.000* |
MPS: Mean Particle Size; SA: Surface Area; EF09: Optimized batch from pervious trial;
*P<0.05 as compared to EF17
Table 7. Effect of β-CD concentration of on Eudragit E 100 nanoparticles
|
Code |
β-CD (mg) |
Distribution Width (nm) |
MPS (nm) |
SA (m² g−1) |
Span |
Uniformity |
||
|
D 10 |
D 50 |
D 90 |
||||||
|
EF17 |
0 |
75±0.0 |
112±0.0 |
169±0.0 |
118±0.0 |
55.9±0.0 |
0.835±0.000 |
0.260±0.000 |
|
EF20 |
50 |
77±0.0 |
116±0.0 |
175±0.0* |
122±0.0* |
54.1±0.0* |
0.842±0.000* |
0.260±0.000 |
|
EF21 |
125 |
78±0.0 |
116±0.0 |
175±0.0* |
122±0.0* |
54.0±0.0* |
0.840±0.000* |
0.260±0.000 |
|
EF22 |
250 |
79±0.0 |
119±0.0 |
179±0.0* |
125±0.0* |
52.9±0.0* |
0.836±0.001* |
0.261±0.000* |
|
EF23 |
500 |
82±0.0 |
124±0.0 |
186±0.0* |
130±0.0* |
50.9±0.0* |
0.834±0.000* |
0.263±0.000* |
MPS: Mean Particle Size; SA: Surface Area; EF17: Optimized batch from pervious trial;
*P<0.05 as compared to EF17
Table 8. Effect of temperature on Eudragit E 100 nanoparticles
|
Code |
Change of water (min) |
Distribution Width (nm) |
MPS (nm) |
SA (m² g−1) |
Span |
Uniformity |
||
|
D 10 |
D 50 |
D 90 |
||||||
|
EF20 |
After 60 |
77±0.0 |
116±0.0 |
175±0.0 |
122±0.0 |
54.1±0.0 |
0.842±0.000 |
0.260±0.000 |
|
EF24 |
Every 15 |
75±0.0 |
112±0.0 |
169±0.0* |
118±0.0* |
55.8±0.0* |
0.837±0.000* |
0.261±0.000 |
|
EF25 |
Every 05 |
74±0.0 |
109±0.0 |
164±0.0* |
115±0.0* |
57.2±0.0* |
0.831±0.000* |
0.262±0.000* |
MPS: Mean Particle Size; SA: Surface Area; EF20: Optimized batch from pervious trial;
*P<0.05 as compared to EF20
Sonication process produce bubbles with size nearer to the resonant size for the applied frequency, which begins to oscillate non-linearly and collapse resulting in production of extremely high temperature, high pressure, and shock wave, which aid the size reduction and evaporation of residual organic solvent present in nanosuspension [22,23]. To study the effect of sonication duration on Eudragit E 100 nanoparticles, we have sonicated the formulation for 60, 45 and 30 minutes. The optimization results (Table 9) has shown decrease in sonication duration significantly (P<0.05) increases the distribution width (D 90), mean particle size, span, and decreases the uniformity. Out of three formulations, EF25 with 60 minutes sonication has shown least distribution width (D 90), mean particle size, span, and higher surface area, which was carried forward for the subsequent optimization.
To study the effect of drug concentration on Eudragit E 100 nanoparticles, we have used 5, 12.5, 25 and 50 mg curcumin. The optimization results (Table 10) has shown addition of drug has significantly (P<0.05) increases the distribution width (D 90), mean particle size, span, and uniformity. Increase in the mean particle size might be due to encapsulation of drug inside the Eudragit E 100 nanoparticles. Out of four formulations, EF30 with 25 mg drug has optimum mean particle size, surface area, span and least uniformity (Fig. 6), which was carried forward to fabricate Curcumin-Piperine, Curcumin-Quercetin, Curcumin-Silibinin loaded Eudragit E 100 nanoparticles.
Plain and dual drug loaded (Curcumin-Piperine; Curcumin-Quercetin; Curcumin-Silibinin) Eudragit E 100 nanoparticles were prepared by optimized modified nanoprecipitation technique and characterized for mean particle size, polydispersity index and zeta potential (Table 11). Prepared Eudragit E 100 nanoparticles were spherical in shape (Fig. 7) and the mean particle size, polydispersity index and zeta potential of the prepared Eudragit E 100 nanoparticles were in the range of 94.67 to 140 nm (Fig. 8), 0.187 to 0.254 and 16.6 to 34.0 mV (Fig. 9), respectively.

Figure 6: Characterization spectrum of formulation EF30.
Table 9. Effect of sonication duration on Eudragit E 100 nanoparticles
|
Code |
Sonication |
Distribution Width (nm) |
MPS (nm) |
SA (m² g−1) |
Span |
Uniformity |
||
|
(min) |
D 10 |
D 50 |
D 90 |
|||||
|
EF25 |
60 |
74±0.0 |
109±0.0 |
164±0.0 |
115±0.0 |
57.2±0.0 |
0.831±0.000 |
0.262±0.000 |
|
EF26 |
45 |
77±0.0 |
116±0.0 |
175±0.0* |
122±0.0* |
54.1±0.0* |
0.840±0.000* |
0.259±0.000* |
|
EF27 |
30 |
70±0.0 |
117±0.0 |
194±0.0* |
126±0.0* |
55.3±0.0* |
1.066±0.000* |
0.329±0.000* |
MPS: Mean Particle Size; SA: Surface Area; EF25: Optimized batch from pervious trial;
*P<0.05 as compared to EF25
Table 10. Effect of various concentration of drug on Eudragit E 100 nanoparticles
|
Code |
Curcumin (mg) |
Distribution Width (nm) |
MPS (nm) |
SA (m² g−1) |
Span |
Uniformity |
||
|
D 10 |
D 50 |
D 90 |
||||||
|
EF25 |
0 |
74±0.0 |
109±0.0 |
164±0.0 |
115±0.0 |
57.2±0.0 |
0.831±0.000 |
0.262±0.000 |
|
EF28 |
5 |
63±0.0 |
115±0.0 |
191±0.0* |
121±0.0* |
60.4±0.0* |
1.113±0.000* |
0.345±0.000* |
|
EF29 |
12.5 |
64±0.0 |
117±0.0 |
191±0.0* |
122±0.0* |
59.5±0.0* |
1.090±0.000* |
0.339±0.000* |
|
EF30 |
25 |
64±0.0 |
117±0.0 |
191±0.0* |
123±0.0* |
59.3±0.0* |
1.083±0.000* |
0.338±0.000* |
|
EF31 |
50 |
3±0.0 |
115±0.0 |
198±0.0* |
123±0.0* |
60.3±0.0* |
1.173±0.000* |
0.363±0.000* |
MPS: Mean Particle Size; SA: Surface Area; EF25: Optimized batch from pervious trial;
*P<0.05 as compared to EF25
Table 11. Characterization of plain & dual drug loaded Eudragit E 100 nanoparticles
|
Code |
Drugs (mg) |
Dual drug combination |
MPS (nm) |
ZP (mV) |
Polydispersity index |
|
EF32 |
0 |
EE 100 nanoparticles |
094.67 |
32.5 |
0.231 |
|
EF33 |
25/25 |
Curcumin and Piperine EE 100 nanoparticles |
140.00 |
28.8 |
0.254 |
|
EF34 |
25/25 |
Curcumin and Quercetin EE 100 nanoparticles |
125.00 |
16.6 |
0.262 |
|
EF35 |
25/25 |
Curcumin and Silibinin EE 100 nanoparticles |
106.00 |
34.0 |
0.187 |
MPS: Mean Particle Size; ZP: Zeta potential; EE 100: Eudragit E 100
In the present study, Eudragit E 100 nanoparticles were prepared by modified nanoprecipitation method and the effect of various process parameters were evaluated by a step-by-step optimization. Least mean particle size, span≤1, surface area >50 m² g-1and uniformity <0.5 was used to evaluate the quality of the prepared nanoparticles. The optimization results has shown that increase in solvent’s polarity, increase in polymer concentration, increase in percentage of ethanol, injection of organic phase, decrease in volume of aqueous phase, addition of poloxamer 188 at and above 250 mg, addition of β-CD, temperature generated during sonication, decrease in sonication duration and addition of drug have significantly increases the distribution width, mean particle size, span, uniformity and decreases the surface area. The optimized formula was 250 mg Eudragit E 100, 50 mg drug, 10 mL of 60% ethanol, 20 mL of distilled water, 125 mg of poloxamer 188, 50 mg of β-CD, sonication duration was 60 minutes and water in the sonicator was replaced with fresh water every 5 minutes. The optimized formula implemented to fabricate curcumin-piperine, curcumin-quercetin, and curcumin-silibinin dual drug loaded Eudragit E 100 nanoparticles. Thus developed modified nanoprecipitation method can be used to routinely to fabricate narrow sized polymeric nanoparticles.

Figure 7: TEM image of EF34.

Figure 8: Particle size spectrum of formulation EF33

Figure 9: Zeta potential spectrum of formulation EF33
Copyright:(c) 2013 M. Chidambaram and K. Krishnasamy. This is an open-access article distributed under the terms of the Creative Commons Attribution License, which permits unrestricted use, distribution, and reproduction in any medium, provided the original author and source are credited.

|
Nano Biomedicine and Engineering. Copyright © Shanghai Jiao Tong University Press |
 |