Review
Surface Enhanced Raman Scattering (SERS): From Fundamental Mechanism to Bio-Analytics Tools
Xiao Zhi 1, Li Lin 1, 2, Di Chen 1*
1 Institute of Nano Biomedicine and Engineering, Shanghai Engineering Center for Intelligent Diagnosis and Treatment Instrument, Department of Instrument Science and Engineering, School of Electronic Information and Electrical Engineering, Shanghai Jiao Tong University, 800 Dongchuan Road, Shanghai 200240, P. R. China.
2 School of Biomedical Engineering, Shanghai Jiao Tong University, 800 Dongchuan Road, Shanghai 200240, P. R. China.
*Corresponding author. E-mail: dchen@sjtu.edu.cn
Received: Dec. 9, 2016; Accepted: Dec. 13, 2016; Published: Dec. 26, 2016.
Citation: Xiao Zhi, Li Lin, and Di Chen, Surface Enhanced Raman Scattering (SERS): From Fundamental Mechanism to Bio-analytics Tools. Nano Biomed. Eng., 2016, 8(4): 297-305.
DOI: 10.5101/nbe.v8i4.p297-305.
Abstract
This review discusses the surface-enhanced Raman scattering (SERS) with efficiencies enhanced by as much as 1014-1015 fold as well as a SERS cross section on the order of 10-17-10-16 cm2/molecule. Despite the existing controversy on the origin of the enhancement, SERS effect offers new opportunities for spectroscopic detection of single molecules near or on the surface of metallic nanoparticles. There has been a considerable amount of research on explanation of the enhancement mechanism and on developing SERS labels as bio-analytics tools for either molecular multiplexed detection or bio-imaging at different levels.
Keywords: Raman; SERS; Machanism; Bio-analytics
Introduction
Surface-enhanced Raman Scattering (SERS) is an ultrasensitive vibrational spectroscopic technique to detect the molecules on or near the surface of plasmonic metal nanostructures [1]. Since its discovery in the 1970s [2], SERS has been applied to many analyses, especially in biochemistry and life sciences [3-6]. The classic application is direct sensing of various analytes attached to a metallic SERS substrate [7], yielding both qualitative and quantitative information of analytes based on its SERS spectra [8, 9]. More recently, this technique has been used to design novel nanoprobes that combine metallic nanoparticles (NPs) and specific organic Raman reporter molecules. Such SERS-active nanoprobes produce strong, characteristic Raman signals and can be used to indirectly sense the target molecules by using laser Raman spectrometry or SERS microscopy, demonstrating optical labeling functions similar to those of external chromophores such as organic dyes and fluorescent quantum dots (QDs). Moreover, this kind of SERS probe has advantages of ultrasensitivity, multiplexing and quantitative abilities, and showing extraordinary features for bioanalysis. Despite tremendous interest in developing SERS probes, research in this area has fallen behind that of other nanoprobes such as QDs and dye-doped nanobeads [10]. A major reason for this is that the mechanisms and fundamental principles of SERS are not as well understood as those of fluorescence. Recent advances in commercial Raman spectrometers and Raman microscopes make it possible to acquire sensitive and reproducible Raman signals and have greatly increased the widespread use of Raman-based detection techniques. Meanwhile, theoretical and experimental investigations of the relationship between noble metal nanosubstrates and SERS enhancement ability [11, 12], as well as the related analytical technique advances, have been reported within the past few years [10]. In this review, we will focus on the theoretical knowledge about SERS tags. First, there is a brief overview of Raman and SERS theory. Next, we will discuss the SERS mechanisms and its biomedical applications.
Fundamental Mechanisms of SERS
Theory of Raman spectroscopy
Raman scattering occurs during inelastic collision of photons with molecules [13, 14]. In this scattering process, photons may gain energy from, or lose it to, the molecules. A change in the photon energy must produce a change in the frequency resulting in scattered photons shifted in frequency by the energy of characteristic molecular vibration. Therefore, a Raman spectrum comprising several different “Raman lines” generated by scattering from different molecular vibrations provides a vibrational “fingerprint” of a single molecule. Depending on whether photons interact with a molecule in its vibrational ground or first excited vibrational state, the scattering signals appear at the low energy side (Stokes) or high energy side (anti-Stokes) of the excitation laser. The scattering signal power of a Raman line depends on excitation intensity and the Raman cross section, whereas the latter is determined by the polarizability derivative of the molecular vibration. In general, anti-Stokes Raman scattering results in much lower scattering signals compared to Stokes scattering, because only a small fraction of molecules (determined by the Boltzmann population) is in an excited vibrational state and can contribute to anti-Stokes Raman scattering. Raman scattering is a very weak effect. Typical Raman cross-section is 10-30-10-25 cm2/molecule with the larger values occurring only under favorable resonance Raman conditions when the excitation light matches the related electronic transition energy in the molecule. In comparison, fluorescence spectroscopy cross-section is 10-17-10-16 cm2/molecule [15].To achieve adequate conversion rates from excitation laser photons to Raman photons, the small Raman cross sections require a large number of molecules. Thus in general, Raman spectroscopy has been considered as a technique for structural analysis, rather than a method for ultra-sensitive trace detection or even as tool for single-molecule probing. However, spectroscopic effects can be strongly affected when they take place in the immediate vicinity of metal surfaces and nanostructures due to coupling to surface plasmons [16, 17]. In surface enhanced Raman scattering (SERS) [18, 19] resonances between optical fields and surface plasmon lead to strongly enhanced Raman scattering signals of molecules in the vicinity of metal nanostructures [20-23]. SERS at extremely high enhancement level brings the effective Raman cross section to a level of fluorescence cross sections and enables the measurement of Raman spectra from single molecules [24, 25]. In SERS, the dimension of the probed volume is determined by the confinement of the local optical field and can be two orders of magnitude smaller than the limit of wavelength [26].
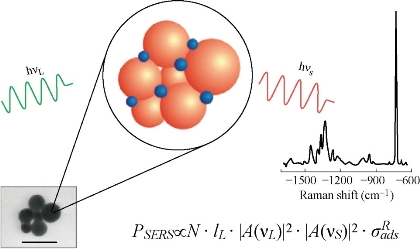
Fig. 1 Schematic of surface enhanced Raman scattering. The SERS spectrum shown as example was collected from 10-9 M adenine in a solution of silver nanoparticle aggregates [23].
Physics and chemistry behind SERS
Fig. 1 gives a schematic of surface enhanced Raman scattering. Molecules (blue dots) are attached to metal nanoparticles (orange balls); see the electron micrograph of colloidal gold particles. In analogy to normal Raman scattering, the SERS signal PSERS depends on excitation intensity IL and an effective SERS cross sections σSERSeff =σRads·|A(νL)2|·|A(νS)2|, which benefits from the electromagnetic enhancement described by field enhancement factors A(νL), A(νS) for the excitation and scattered field and a chemical SERS effect, described by an increased Raman cross section of the adsorbed molecule compared to the cross section in a “normal” Raman experiments. N is the number of molecules involved in the SERS process [23]. Here, two primary theoretical mechanism models- long-range electromagnetic (EM) enhancement and short-range chemical enhancement (CE), will briefly introduced to explain the enhanced-Raman phenomenon [1]. Electromagnetic field enhancement exists due to resonances of the optical fields with surface plasmons [27, 28]. When the frequency of incident light is resonant with a plasmon, then the metal NP will radiate a dipolar field and be coherent with the exciting electric field. This leads to a redistribution of field intensities in the vicinity of nanoparticles resulting in areas of enhanced excitation intensities for the Raman process around the nanoparticle (called a “hot spot”). A molecule near or adsorbed at the hot spot will experience much-enhanced incident intensity that excites its Raman mode. The scattered Raman signal will be further magnified in the same way, resulting in a greater increase in the total output. When both the incident light and the scattered signal of molecules are in resonance with the plasmon frequency, then the SERS signal is maximized, leading to approximately 104 scale enhancement [29]. This enhancement has a strong analyte distance-dependence feature: Only molecules on or very close to the metal surface experience the enormous field enhancement [1]. Chemical or electronic enhancement includes effects associated with an electronic coupling between molecule and metal, and can be explained in two ways [30]. One explanation is that the interaction between molecule and metallic surface induces novel charge-transfer intermediates that have higher Raman scattering cross sections than do those of the analyte that is unadsorbed and on the surface. The other explanation is that when the lowest unoccupied molecular orbital and highest occupied molecular orbital of the chemisorbed molecules fall symmetrically about the Fermi level of the metal surface, then the excitation of half the energy can make the transition. This could explain the dependence of the SERS enhancement on the electrode potential and also differences in SERS enhancement factors for different molecules [12].
SERS active sites
Numerous studies suggest that the SERS active sites are likely adatoms, atomic clusters, sharp steps, or edges [31, 32]. They are responsible for chemical enhancement via resonant charge-transfer and resonance-Raman-like enhancement [33]. In other words, strong electronic coupling between an adsorbed molecule and an active site generates new metal-to-ligand or ligand-to-metal charge transfer states that can be broadly excited at visible wavelengths. Hildebrandt and Stockburger [34] reported the SERS active sites are high-affinity binding sites (65 kJ per mole) associated with adsorbed anions such as Cl- or Br-. To provide further insight into the nature of active sites, Doering and Nie [35] developed an integrated flow-injection and spectroscopy system to study the replacement of one adsorbed molecule by another (Fig. 2). A key observation is that before halide treatment, the SERS spectrum often contains a broad background and weak signals from citrate (or its degradation products), but no detectable R6G signals. Upon halide addition, they found that the R6G spectrum suddenly replaces the citrate spectrum and appears over the background in a single step. This replacement behavior is consistent with the conclusion that the SERS spectrum is dominated by a single or a few molecules adsorbed at active sites. Furthermore, the results suggest that the active sites are initially empty or are occupied by citrate ions. Van Duyne and coworkers used two isotopologues of Rhodamine 6G that offer unique vibrational signatures but with identical surface binding properties [36]. When an average of one molecule is adsorbed per silver nanoparticle, only one isotopologue is typically observed in a dry nitrogen environment. At higher coverage and in humid environments, adsorbate interchanges occur due to competitive adsorption at a single site of the same location. Using 2D cross correlation, vibrational modes from different isotopologues are anti-correlated, indicating that the dynamic behavior is from multiple molecules competing for a single hot spot.
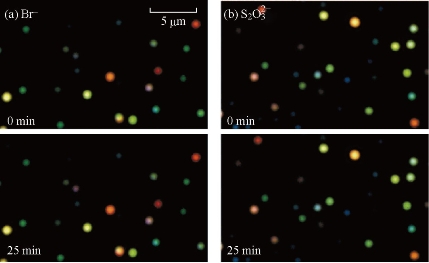
Fig. 2 Surface plasmon resonance scattering images of single immobilized nanoparticles before and after chemical treatment. Panel (A) shows particle scattering images before and after treatment with 10 mM bromide, whereas panel (B) shows particle scattering images before and after treatment with 10 mM thiosulfate. Note that no changes in scattering intensity or color were observed for any of the immobilized particles (either SERS active or inactive).
Blinking and wandering
Single metal nanoparticles and nanoaggregates have been reported to emit intense bursts of surface-enhanced Raman scattering (SERS) in an intermittent on and off fashion (Fig. 3) [25, 37]. The characteristic “blinking” time scales range from milliseconds to seconds. Several lines of evidence suggest that the observed fluctuations are caused by thermally activated diffusion of individual molecules on the particle surface. Wavelength-resolved spectroscopy has further revealed that the fluctuating signals arise from surface-enhanced Raman scattering, and not from photoluminescence or elastic Rayleigh scattering [38]. The measured intensities represent the total Raman and background signals integrated over the spectral region of 557-663 nm (5-6 nm band-pass filter). Another important feature is that the SERS spectrum contains a significant background. This background is not due to residual R6G fluorescence but due to an emission continuum that is commonly observed in SERS [38]. The photon counts during the “off” periods are very low, indicating that the SERS signals and the background are correlated and fluctuate simultaneously (in phase). Brus and co-workers [39] reported a strong correlation of their SERS intensities and the background continuum with time. The photon bursts also appear to cluster with repeated bursts followed by dark periods. Statistical analysis of a large number of nanostructures indicates that the average on-time (ton) is about 80 ms with 0.1mW laser excitation (~0.5 mm focal spot) at room temperature. A further intriguing finding is spectral wandering; that is, the SERS signals suddenly change their frequencies. As first reported by Nie, changes in the Raman signal frequencies of Rhodamine 6G are as large as10 cm-1 [25]. Even when sudden spectral changes are not observed, the Raman spectra obtained from different particles have slightly different vibrational frequencies.
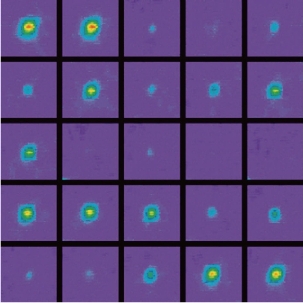
Fig. 3 Time-lapsed video images of intermittent light emission recorded from a single silver nanoparticle. The images are ordered from left-to-right with an elapsed time of 100 ms between the images. The signal intensities are indicated by false colors [37].
Chemical activation and deactivation
The difficulties in separating the chemical enhancement effect from the electromagnetic field effect have been the major challenges in studying the mechanisms of SERS. Doering and Nie [35] directly examined chemical enhancement by using an integrated flow injection and ultrasensitive optical imaging/spectroscopy system. In the system the colloidal silver nanoparticles are immobilized on a glass surface inside a microflow device, and that single-particle SERS signals are observed in real time while the immobilized particles are treated by chemical reagents in the flow cell. In situ surface plasmon scattering studies of spatially isolated particles indicate that their electromagnetic properties do not change after chemical treatment. Thus, the observed SERS spectral changes should primarily come from chemical enhancement at surface active sites. Another experimental data reveal that three halide ions (Cl-, Br- and I-) have a substantial activating effect, while other ions such as citrate, sulfate and fluoride have little or no effect on single-particle SERS. A “quenching” effect is observed for thiosulfate ions, which completely destroys the SERS activity. However, neither the halide ions nor thiosulfate produces detectable changes in surface plasmon scattering (both color and intensity) after 25 min of treatment [40]. As mentioned above, surface plasmon scattering provides an excellent measurement of the electromagnetic properties of single and aggregated colloidal nanoparticles. The observed activation/deactivation effect is primarily due to atomic-scale changes on the particle surface, not large-scale changes that would change the electromagnetic characteristics of the particles. Further wavelength-resolved studies of single-particle plasmon scattering could show small changes (5-10 nm) in the scattering spectra, while such small shifts are unlikely to cause significant changes in electromagnetic enhancement.
SERS in Bio-Analytics
There are several potential capabilities that make SERS a promising method in bioanalytics [41]. It effectively combines the high level of molecular structural information of a vibrational spectroscopy with ultrasensitive detection limits. This allows to detect molecules and to establish their structural identity in very small quantities down to the single-molecule level. Probed volumes at the level of nm offer the opportunity to probe small biological structures.
Table 1 Comparison of SERS Tags, Quantum Dots, and Conventional Dyes [30]
|
Properties |
SERS Tags |
Quantum Dots |
Conventional Dys |
|
Physical principle |
Raman scattering |
Fluorescence emission |
Electronic absorption/flurescence emission |
|
Core composition |
Au and Ag based NPs |
CdSe and CdTe based NPs |
Organic compounds |
|
Size |
~50 nm |
~10 nm |
~1 nm |
|
Bandwidth |
Less than 2 nm |
~30-50 nm |
Usually more than 50 nm |
|
Structural information |
fingerprint |
nofingerprint |
no fingerprint |
|
Multiplexing capacity |
~10-100 |
~3-10 |
~1-3 |
|
Photostability |
antiphotobleaching |
decay under strong laser |
decay under weak excitation |
SERS tags
A SERS tag (or called SERS label) is created by attaching intrinsically strong Raman scattering molecules (called Raman reporters) to the surface of plasmon-resonant Ag or Au NPs, thereby creating a known characteristic Raman spectrum of the reporter with enhanced intensities. Additionally, the SERS tag can be functionalized using specific linker in order to target specific biomolecules or biological structures. The development of SERS tags can be considered a significant step forward in the spectroscopic analysis of biological samples because these tags offer several advantages over other optical probes, such as organic fluorescence dyes and QDs (Table 1.) [30]
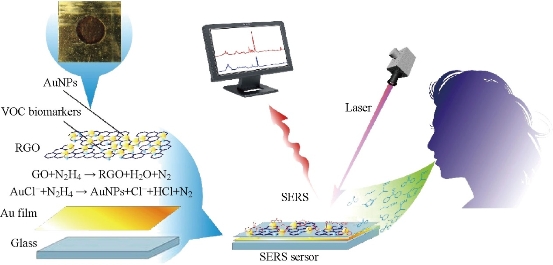
Fig. 4 Schematic diagrams of SERS sensor for detecting volatile organic compounds (VOCs) in the breath for early gastric cancer diagnosis [42].
Biomarker detection
Souza et al. has achieved specific biomolecule targeting in a native cellular environment using SERS tags [43]. Au–bacteriophage–imidazole complexes are used to label cells in solution, but the phage network has an intense background SERS signal that limits the assay signal-to-noise ratio and does not protect the tags from spectral changes and aggregation. Huang et al. [44] demonstrated antibody-conjugated gold nanorods as potential cancer diagnostic markers using the surfactant CTAB as a reporter molecule for SERS readout. Hu et al. [45] linked Raman reporter with cyano groups in order to distinguish its vibrational peak from other contamination signals. Yu et al. [46] combined SERS Ag nanoshells with fluorescent dyes to examine the Raman signals from the reporter molecules together with fluorescent images. Chen et al. [42] developed a SERS sensor comprising of gold nanoparticles and reduced graphene oxide to detect fourteen volatile organic compounds (VOCs) biomarkers in the breath to distinguish early gastric cancer (EGC) and advanced gastric cancer (AGC) (Fig. 4). Lei et al. [47] reported a sea-urchin-like Au nanocluster (AuNC) can be used for efficient detection of EGFR mutation in malignant pleural effusion (MPE) with an overall accuracy of 90.7%.
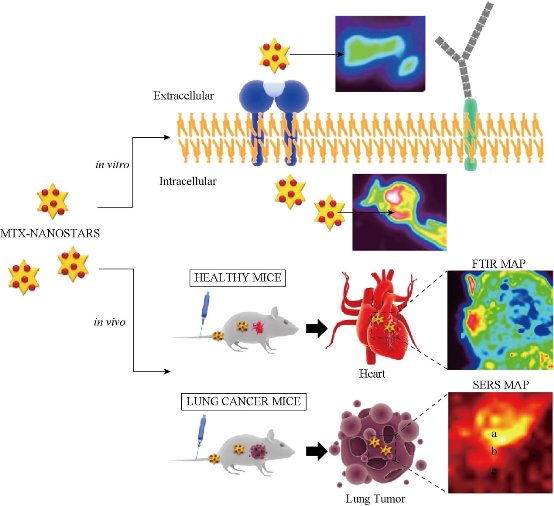
Fig. 5 Gold nanostars for theranostics: intracellular and in vivo SERS detection combined with real-time drug delivery using plasmonic-tunable Raman/FTIR imaging. This system can directly track in real-time the delivery and release of an anticancer drug (mitoxantrone-MTX) from gold nanostars in single living cells and in mice (healthy and lung cancer mice models).
Chemical probes in live cells
Gold nanoparticles have been tools of the trade in cell biology because of their favorable physical and chemical properties and biocompatibility. An exciting new aspect in their applications exploits gold nanoparticles as multifunctional SERS nanosensors. These mobile sensors can probe cellular chemistry at sub-endosomal resolution by delivering the enhanced Raman spectra of cellular molecules in their nanoenvironment [22, 48]. Moreover, SERS probes fulfill the requirements of dynamic in vivo systems—the use of very low laser powers and very short data acquisition times. For example, gold nanoparticles have been used to directly probe the chemical composition of endosomes of different stages and for the detection of specific cellular molecules. Gold or silver nanoparticles can serve in cells also as labels that highlight cellular structures based on the surface enhanced Raman signature of a reporter molecule linked to them [49]. Tian et al. [50] proposed a new theranostic strategy based on an efficient plasmonic-tunable Raman/Fourier transform infrared (FTIR) spectroscopy imaging, to simultaneously evaluate the anticancer drug scattering cellular imaging and the Raman scattering molecular vibration signals in living cells (Fig. 5). This technique allows to monitoring the drug release throughout the cell cycle and in vivo biodistribution and biocompatibility with low dose drug therapy and low toxicity effect. Gold or silver nanoparticles with reporter molecules attached that exhibit a known and calibrated pH dependent SERS signature [51], can act also as intracellular pH probe (Fig. 6) [33]. Monitoring pH in cells and cellular compartments is of particular importance for a better understanding of a broad range of physiological and metabolic processes.
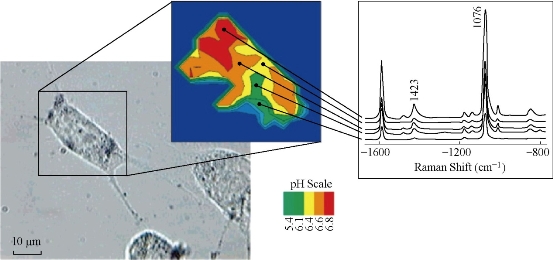
Fig. 6 Probing and imaging a live cell filled with gold nanoparticles. Surface enhanced Raman scattering measures the pH-sensitive spectrum of 4-mercaptobenzoic acid on the gold particles. The relative intensity ratios of the Raman lines at 1423 cm-1 and 1076 cm-1 can be calibrated to the pH levels to map them out in different cellular compartments. Each spectrum was collected in 1 second using 3 mW, 830 nm continuous-wave laser excitation [52].
Conclusions
SERS at extremely high enhancement level transforms Raman spectroscopy from a structural analytical tool to a structurally sensitive single molecule and nanoscale probe. Exciting applications demonstrate the potential of the method, particularly also in bio-spectroscopy. A big challenge remains in all basic studies and applications is the control of SERS enhancement. The best enhancement factors observed experimentally so far are that in random SERS systems, such as aggregates of gold and silver nanoparticles. Further development in nanotechnology will enable us to build such nanostructures in a controlled way and to probe these structures with an “nm” resolution. In addition to "nanoscale" design between 10-100nm, which controls the electromagnetic enhancement, electronic and "atomic scale" properties will be important in controlling also the "electronic" contribution to the enhancement as well as blinking, wandering and the binding or release of target molecules.
Acknowledgments
This work supported by National Natural Scientific Fund (No. 81225010), the National Key Basic Research Program (973 Project) (No. 2010CB933901 and 2015CB931802), 863 Project of China (No. 2014AA020700), Shanghai Science and Technology Fund (No. 13NM1401500).
References
Copyright© 2016 Xiao Zhi, Li Lin, and Di Chen. This is an open-access article distributed under the terms of the Creative Commons Attribution License, which permits unrestricted use, distribution, and reproduction in any medium, provided the original author and source are credited.

|
Nano Biomedicine and Engineering. Copyright © Shanghai Jiao Tong University Press |
 |