Research Article
Spectrophotometric Determination of Vitamin Folic Acid B9 in Some Drugs Using 1,2-Naphthoquine-4-Sulphonate (NQS)
Riyadh Radhi Al-Araji 1*, Muthana Saleh Mashkour 1, Emad Abbas Jaffar Al-Mulla 2*
1 Department of Chemistry, Faculty of Science, University of Kufa, P.O. Box 21, An-Najaf 54001, Iraq.
2 College of Health and Medical Techniques, Al-Furat Al-Awsat Technical University, 54003 Al-Kufa, Iraq.
* Corresponding authors. E–mail: mscriyadh1973@gmail.com; almullaemad@gmail.com
Received: Jul. 19, 2017; Accepted: Aug. 14, 2017; Published: Sep. 15, 2017
Citation: Riyadh Radhi Al-Araji, Muthana Saleh Mashkour, and Emad Abbas Jaffar Al-Mulla, Spectrophotometric Determination of Vitamin Folic Acid B9 in Some Drugs Using 1,2-Naphthoquine-4-Sulphonate (NQS). Nano Biomed. Eng., 2017, 9(3): 208-213.
DOI: 10.5101/nbe.v9i2.p208-213.
Abstract
In this study, simple and sensitive spectrophotometric method for the determination of folic acid (VB9) in pharmaceutical formulations was reported. The proposed method was based on the reaction between folic acid and 1,2-naphthoquine-4-sulphonate (NQS) at alkaline medium (pH 11) to form deep yellow product. Beer’s law was obeyed in the range of 0.75 - 10.5 μg/mL of folic acid at maximum wavelength of 436 nm. Under optimized reaction conditions, linear regression equation of the calibration curve was y = 0.048 x + 0.038 (μg/mL) with a linear correlation coefficient of 0.9988. The limit of detection (LOD) and limit of quantification (LOQ) were found to be 0.159 μg/mL and 0.531 μg/mL, respectively. The method was successfully applied to the determination of folic acid in pharmaceutical formulations.
Keywords: Folic acid (B9); Spectrophotometric; Pharmaceutical formulation; 1-2-naphthoquine-4-sulfonate (NQS)
Introduction
Folic acids as folate vitamin, vitamin B9 [1], vitamin Bc (or folacin) and pteroylmono glutamic acid [2] are forms of the water-soluble vitamin B9. Folate has low solubility in water and is being more soluble in alkaline and saline media solutions [3], its solubility increases with the increasing of pH especially [4]. Causes of deficiency nutritional deficiency of folate is common in people consuming a limited diet. Symptoms of folate deficiency include weakness, fatigue, difficulty in concentrating, irritability, headache, palpitations, shortness of breath and atrophic glossitis [5-7]. Symptoms of folate deficiency are macrocytic anaemia and gastro intestinal tract mucosa deterioration as a result of decreased replacement of red blood and mucosa cells [8]. Pregnant women are at risk of folate deficiency because pregnancy significantly increases folate requirement, especially during periods of rapid foetal growth (second and third trimester). Losses of folate in milk during lactation also increase the requirement for lactating mother [9]. Deficiency can occur wherever cell multiplication must increase: in pregnancies especially involving twins, during cancer, in skin-destroying diseases, in burns, blood loss and gastro intestinal tract damage [10]. Many analytical methods have been reported for the analysis of vitamin B9, including electrochemical sensors [11–12], spectrophotometry [13], chemiluminescence [14], capillary electrophoresis [15] and high performance liquid chromatography (HPLC) [16]. Spectrophotometry is considered the most convenient analytical technique, because of its inherent simplicity and low cost [17,18]. 1-2-naphthoquine-4-sulfonate (NQS) has been used as a color-developing reagent in the spectrophotometric determination of many pharmaceutical amines [19, 20]. It is a popular spectrophotometric reagent due to its efficient reactivity with both primary and secondary amines, and high reaction rate [21]. In depth review on applications of NQS for the determination of pharmaceutical bearing amine group have been reported by Elbashir et al. [22, 23]. The reagent produces a bright red colour in alkaline solutions and is also fluorescent [23]. This should not be confused with Folin-Ciocalteu reagent, which is a mixture of sodium tungstate and sodium molybdate that is used to detect phenolic compounds [24]. The reaction between NQS and folic acid has not been investigated yet [25]. Therefore, the present study was devoted to investigating the reaction between NQS and folic acid, using this color reaction in the development of simple rapid spectrophotometric method for determination of folic acid in its dosage form.
Experimental
Apparatus
Absorbance was carried out by using 1800 PC UV-visible spectrophotometer, Shimadzu, Japan (Double beam), with quartz cells of 1 cm optical path length, pH meter was used for pH measurements, analytical balance and water bath.
Material and reagent
Folic acids were obtained from Autama Development Company Ltd., (agent of Sigma-Aldrich), used as received, the purity of which was 98%, and from England company Ltd., used as received, the purity of which was 99%. The preparation of the solution of vitamin B9 involved dissolving 0.1 g vitamin in the alkaline solution of 0.1 mol NaHCO3 in 1 L volumetric flask. A solution of 0.6% (w/v) NQS was prepared by dissolving 0.6 g in distilled water, transferred into a 100 mL volumetric flask and diluted to the mark with buffer solution and mixed well. The solution was freshly prepared and protected from light during use; buffer solution of pH 11 was prepared from NaOH/NaHCO3 [26].
Preparation of standard and sample solution
The standard stock solution of folic acid (100 μg/mL) was prepared from 0.1 g folic acid dissolved in alkaline solution, then transferred into 1,000 mL volumetric flask, diluted to the mark with the same solvent and mixed well. This stock solution was further diluted to obtain working solutions in the range of 0.75 - 12 μg/mL.
Sample solution
To prepare the stander solution of vitamin from drug (10.5 µg/mL), one tablet (0.1 g / tablet) was taken, weighted and finely-grinded, then dissolved in 10 mL alkaline solution (0.1 mol NaHCO3) filtered and 1.0 mL solution was obtained. Then, 2.5 mL NQS was added in 10 mL volumetric flask and followed to mark by buffer solution (pH 11).
Procedure
1.50 mL of 100 μg/mL folic acid was transferred into 10 mL volumetric flask; 2.5 mL of 0.6% NQS was added to the buffer solution of pH 11 (NaOH / NaHCO3). The reaction was completed to volume by buffer solution, and the resulting solution was measured at 436 nm against reagent blank treated similarly.
Job’s method
The Job’s method of continuous variation [27-29] and mole ratio [30] were employed to evaluate the stoichiometric ratio of formation reaction. Master equimolar (5×10⁻³ mol) aqueous solution of folic acid hydrochloride and NQS were prepared. Series of 10 mL portions of the master solution of folic acid and NQS were made comprising different complementary proportions (1:9,…9:1, inclusive) of reagent and vitamin B9 under optimal condition at wavelength of 436 nm and the ratio of vitamin to reagent at 1:1.
Results and Discussion
Absorption spectra
The absorption spectrum of folic acid was recorded against alkaline solution (Fig. 1). It was found that folic acid exhibited a maximum absorption peak (λ max) at 318 nm, and the derivatization of folic acid red–shifted light-absorbing derivative was necessary. The reaction between folic acid and NQS was performed, and the absorption spectrum of the product was recorded against reagent blank. It was found that the product was brown colored exhibiting λ max at 436 nm, and the λ max of NQS was 384 nm. The λ max of folic acid-NQS derivative was red-shifted, eliminating any potential interference. Therefore, the measurements were carried out at 436 nm.
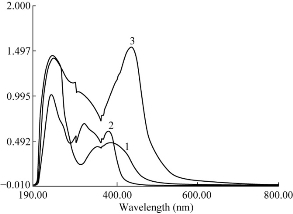
Fig. 1 Absorption spectra of (a) NQS (0.006% (w/v); (b) Folic acid (vitamin B9) (100 μg/mL); and (c) The reaction product of folic acid with NQS.
Optimization of the reaction conditions
Effect of volume of the vitamin
The study investigated the effect of the volume of vitamin by taking different amounts of vitamin B9 and measuring the absorption intensity of solution using the wavelength of vitamin. The highest absorption intensity was detected at the best volume of vitamin B9 at 1.5 mL (Fig. 2).
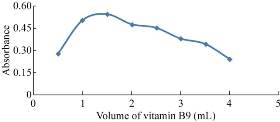
Fig. 2 Effect of volume of vitamin B9.
Effect of NQS concentration
The study of NQS concentrations revealed that the reaction was dependent on NQS reagent (Fig. 3). The absorbance of the reaction increased as the NQS concentration increased, and the highest absorption intensity was attained at NQS concentration of 0.1% (w/v). Higher NQS concentrations up to 1% had no effect on the absorption values. Further experiments were carried out using 0.6% (w/v).
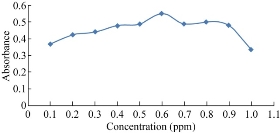
Fig. 3 Effect of NQS concentration on the reaction of folic acid with NQS.
Effect of the volume of reagent
The effect of the volume of reagent on the intensity of absorption of the resulting dye was studied by taking different volumes of reagent with a concentration of 0.6% (w/v) NQS for vitamin B9. The highest absorption intensity was detected at 2.5 mL (Fig. 4).
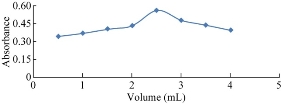
Fig. 4.Effect of volume of NQS on the reaction.
Effect of pH of the buffer solution
The effect of pH on the reaction between vitamin B9 and NQS was examined by varying pH from 9 to 13. As shown in Fig. 5, the absorbance of the product was low at pH 9, indicating that vitamin had difficulty reacting with NQS at pH 9. This was possibly due to the existence of the amino group of vitamins in the form of salt, thus it lost its nucleophilic substitution capability. The reaction of NQS with compound bearing primary amines at pH 11 was reported [31].
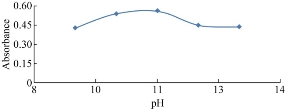
Fig. 5 Effect of buffer pH on the reaction of folic acid with NQS.
Effect of amount of the buffer
After detecting the best volume of vitamin B9 and volume of NQS, the best volume of vitamin B9 and NQS were mixed in 10 mL volumetric flask and completed to the mark by buffer solution (pH = 11). The highest absorbance of vitamin volume was recorded.
Effect of reaction time
To study the effect of time in the stability of the mixture consisting of NQS and vitamin, the absorbance of the reaction product was determined at different time (Fig. 6). The absorbance of the reaction product was measured after standing for different time under the other optimal condition. The best reaction time of the mixture was detected on account of the high absorbance from vitamins B9 in 15 min.
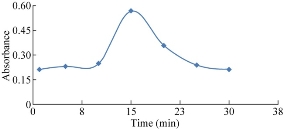
Fig. 6 Effect of standing time on the reaction of folic acid with NQS.
Effect of temperature
The effect of temperature on the stability of NQS and vitamin reaction was detected. Fig. 7 reveals the best temperature for reaction was 35 °C when vitamin B9 gave the highest absorption.
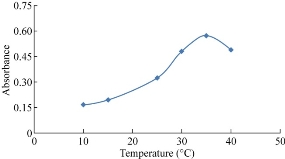
Fig. 7 Effect of temperature on the reaction of folic acid with NQS.
Effect of addition order
To obtain optimum results, the effect of addtion order of materials on the absorption of reaction was studed based on three procedures (Table 1). Table 1 shows the regular materials which gave higher absorption due to the formation of chemical reaction.
Table 1 Addition order of vitamin B9
|
No. |
Addition order |
Absorbance |
|
1 |
NQS + Buffer + B9 |
0.401 |
|
2 |
B9 + NQS + Buffer |
0.388 |
|
3 |
NQS + B9 + Buffer |
0.489 |
Calibration curve of vitamin B9
Fig. 8 shows the standard calibration curve for the estimation of vitamin B9 which turned out to obey Beer’s law. The absorbance was between the range of 0.75 - 10.5 ppm under the best conditions at the maximum wavelength of 436 nm, and the correlation coefficient was R = 0.9988. The value of Ɛ molar absorptivity was equal to 2.1187 × 10⁴ L/mol/cm. Sandell’s sensitivity was calculated by calculating the coefficient of specific absorption of the following relationship and was equal to 0.038 µg/mL. The high value of molar absorptive and Sandell’s sensitivity made this analytical method prefer vitamin B9 determination at low concentrations.
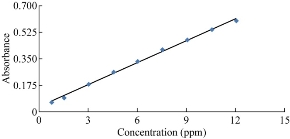
Fig. 8 Calibration curve of vitamin B9.
Linearity, limit of detection (LOD) and limit of quantification (LOQ)
The linearity was evaluated by linear regression analysis determined by constructing seven concentrations of folic acid [32] in the range of 0.75 – 12 μg/mL which was calculated by the least square regression method to calculate the calibration equation and the correlation coefficient. The calibration curves were constructed by plotting concentration versus absorbance, using linear regression analysis. The regression equation for the results was A = 0.048x + 0.038 (R2 = 0.9977), where A was the absorbance at 436 nm, x was the concentration of folic acid in μg/mL in the range of 0.75 - 12 μg/mL, and R was the correlation coefficient (Table 2). The limit of detection (LOD) and the limit of quantification (LOQ) were determined according to the formula: LOD = 3.3 × SDa / b, and LOQ = 10 × SDa / b, where SDa was the standard deviation of the blank, and b was the slope under the ICH guidelines [33].
Table 2 Analytic parameter for folic acid determination
|
Parameter |
Value |
|
Measurement wavelength (nm) |
436 |
|
Linear range (μg/mL) |
0.75 - 12 |
|
Detection limit (μg/mL) |
0. 159 |
|
Sandell's sensitivity(μg/cm) |
0.0208 |
|
LOQ (μg/mL) |
0.531 |
|
Correlation coefficient (R) |
0.9988 |
|
Determination coefficient (R2) |
0.9977 |
|
Slope (b) |
0.048 |
|
Intercept (a) |
0.038 |
Accuracy
To check the accuracy and precision of the proposed method, precision was calculated using five replicates at the concentration of 10.5 μg/mL vitamin B9 mixure. The calculation is shown in Table 3 where relative standard deviation (RSD) was applied to proposed methods to determine vitamin B9 [34].
Table 3 Relative error and recovery as parameters to express the accuracy of methods determing folic acid.
|
Parameters |
Values |
|
Measurement wavelength (nm) |
436 |
|
Concentration (μg/mL) |
10.5 |
|
R |
0.9988 |
|
X ¯ |
0.5504 |
|
RSD (%) |
0.0198 |
|
Error (%) |
0.015 |
|
DL (μg/mL) |
0.606 |
|
Recovery (%) |
100.015 |
R: Correlation coefficient
RSD: relative standard deviation
X ¯: Absorbance of blank
DL: Detection limit
Stoichiometry of derivatization reaction
Job’s method of continuous variation and mole ratio was employed to evaluate the stoichiometric ratio of formation reaction between the reagent and vitamin B9 under the optimal condition: wavelength at 436 nm and the ratio of vitamin to reagent at 1:1 (Fig. 9 & 10). The suggested reaction formula of folic acid and NQS is illustrated in Scheme 1.
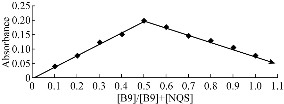
Fig. 9 The continuous variation plot for the stoichiometry of the reaction between folic acid and NQS.
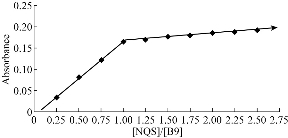
Fig. 10 The continuous variation plot for the mole ratio of the reaction between folic acid and NQS.
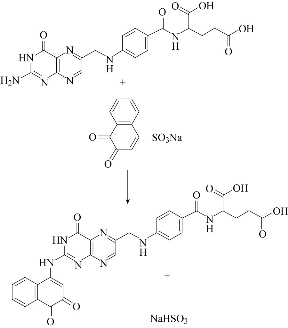
Fig. 11 Scheme for the reaction pathway of folic acid and NQS.
Application of the proposed method to analyse folic acid drug formulations
The proposed method indicated the analytic purpose of determining vitamin B9 in tablets and capsules. The results are listed in Table 4 to determine vitamin B9 in pharmacological formula by spectrophotometric methods.
Table 4 Analytical applications
|
Sample |
Concentration / mg |
|
|
|
|
Present |
Found |
Error (%) |
Recovery (%) |
|
|
Femifol tablets (Germany) |
5 |
4.921 |
+1.58 |
101.58 |
|
Folicroncapsul (UAE) |
0.5 |
0.503 |
- 0.6 |
99. 4 |
Conclusions
The present paper described the evaluation of NQS as analytical reagents in the development of simple, sensitive, quick and accurate spectrophotometric methods for the determination of folic acid in pharmaceutical formulation. The best conditions in terms of concentration of the reagent NQS, temperature, time reaction and pH of the solution were studied. The proposed method was reproducible for the determination of folic acid in commercially available dosage forms.
Conflict of Interests
The authors declare that no competing interest exists.
References
Copyright© 2017 Riyadh Radhi Al-Araji, Muthana Saleh Mashkour , and Emad Abbas Jaffar Al-Mulla. This is an open-access article distributed under the terms of the Creative Commons Attribution License, which permits unrestricted use, distribution, and reproduction in any medium, provided the original author and source are credited.

|
Nano Biomedicine and Engineering. Copyright © Shanghai Jiao Tong University Press |
 |