Research Article
Synthesis and Biological Screening of the Gold Complex as Anticancer and Some Transition Metal Complexes with New Heterocyclic Ligand Derived from 4-Amino Antipyrine
Layla Ali Mohammed *, Raheem Tahir Mehdi, Abid Allah Mohammed Ali
Department of Chemistry, College of Education for Girls, University of Kufa, Iraq.
* Corresponding author. E-mail: laila.alameri@uokufa.edu.iq
Received: Mar. 20, 2018; Accepted: Jun. 3, 2018; Published: Jul. 10, 2018
Citation: Layla Ali Mohammed, Raheem Tahir Mehdi, and Abid Allah Mohammed Ali, Synthesis and Biological Screening of the Gold Complex as Anticancer and Some Transition Metal Complexes with New Heterocyclic Ligand Derived from 4-Amino Antipyrine. Nano Biomed. Eng., 2018, 10(3): 199-212.
DOI: 10.5101/nbe.v10i3.p199-212.
Abstract:
A new azo Schiff-base ligand, (N1Z,N2Z)-N1,N2-bis(4-((Z)4-hydroxy naphthalen-1-yl)diazenyl)-(1,5-dimethy-2-phenyl-1H-pyrazol-3(2H)-ylidene) benzene-1,2-diamine, has been synthesized from coupling (N1Z,N2Z)-N1,N2-bis(4-amino-1,5-dimethyl-2-phenyl-1H-pyrazol-3(2H)-ylidene)benzene-1,2-diamine with 1-naphthol. Fourier-transform infrared spectroscopy (FTIR), proton nuclear magnetic resonance (1H-NMR), carbon nuclear magnetic resonance (13C-NMR) technique, ultraviolet-visible spectroscopy (UV-Vis), mass analysis, molar conductance and magnetic susceptibility were used to characterize the structures of the new ligand and their transition metal complexes. The complexes were found to have the general formula (M)(L)Cl2 where M = Co(II), Ni(II), Cu(II), Zn(II), Cd(II) and Hg(II), (M)(L)Cl3 where M = Au(III), and (M)(L)Cl2Cl where M = Fe(III). The FTIR results demonstrated that the coordination sites were the azomethine nitrogen and azo nitrogen atoms of the azo Schiff-base ligand. The electronic spectral and magnetic measurement data indicated that the complexes exhibited octahedral geometry, except the Au(III) complex suggested a square planar geometry around the central metal ion. The results showed the highest inhibitory effect for gold the complex. The effect of biological screening of the gold complex on human colon cancer cell line LS-174 was investigated. The gold complex was observed to have the highest inhibitory effect.
Keywords: 4-Amino antipyrine; Azo Schiff-base; Transition metal complexes; Antitumor activity
Introduction
A great deal of work has been reported on the synthesis and characterization of different types of azo Schiff bases. Due to the excellent donor properties of the azo and azomethine groups, these compounds present one important field in coordination chemistry [1, 2]. In addition to their interesting coordination properties, azo Schiff-base metal complexes have been studied extensively for years due to the synthetic flexibilities of these Schiff-base ligands and their selectivity as well as sensitivity towards the transition metal ions, and that their complexes have important biological activities [3], redox and catalytic properties [4], corrosion inhibition [5], and antimicrobial reagent [6]. 4-aminoantipyrine heterocyclic compound has gained great importance as it is abundant in nature and wide pharmacological activities. 4-aminoantipyrine is a pyrazole derivative which has antipyretic action. It is used in the preparation of azo dyes [7] and Schiff base [8], also used to protect against oxidative effect as well as prophylactic of certain diseases including cancer [9]. Several derivatives of antipyrine were also evaluated as analgesic [10], anti-inflammatory [11], antimicrobial [12] and anticancer [13]. The aim of this paper is to synthesize, characterize and study the biological screening of the gold complex as anticancer of the new tetra dentate azo Schiff-base ligand, (N1Z,N2Z)-N1,N2-bis(4-((Z)4-hydroxy naphthalen-1-yl)diazenyl)-(1,5-dimethy-2-phenyl-1H-pyrazol-3(2H)-ylidene) benzene-1,2-diamine and some of its transition metal complexes.
Experimental
Materials
All chemicals were supplied by BHD and Sigma Aldrich, Germany, and used without further purification.
Measurement
The electro-thermal melting point model 9300 was used to measure the melting point of the ligand and its complexes. Elemental analyses were carried out by means of micro analytical unit of 1180 C. H. N elemental analyzer. Electronic spectra were recorded on Shimadzu spectrophotometer double beam model 1700 ultraviolet-visible (UV-Vis) spectrophotometer. Fourier-transform infrared (FTIR) spectra were recorded in KBr disc on FTIR Shimadzu spectrophotometer model 8400 in wave number 4000-400/cm. Proton nuclear magnetic resonance (1H-NMR) and carbon nuclear magnetic resonance (13C-NMR) spectra in ppm unit were operating in dimethyl sulfoxide-d6 (DMSO-d6) as solvent using(Bruker Ultra Shield 3000 MHz, Switzerland). And mass spectra were recorded on AB Sciex 3200 QTRAP LC/MS/MS (mass range m/z 5-2000 quad mode and 50-1700 linear ion trap mode). Magnetic susceptibility measurements were carried out on a balance magnetic MSB-MKI using faraday method. The diamagnetic corrections were made by Pascal's constants.
Preparation of the azo Schiff-base ligand
Preparation of the Schiff base
The Schiff base ligand was prepared by condensation of 1.08 g, 0.01 mol o-phenylene diamine with 4.064 g, 0.02 mol 4-amino antipyrine at 1 : 2 mole ratio, in absolute alcohol. A few drops of glacial acetic acid were added to the reaction mixture and refluxed with stirring for 35 h. With the precipitate product collected by filtering off, the resulting solution was evaporated to half volume, purified by crystallization from hot ethanol, and dried over anhydrous CaCl2. Yield = 88%; melting point (MP) = 125-127 ℃ (Scheme 1).

Scheme 1 Preparation of the Schiff-base ligand.
Preparation of the azo Schiff-base ligand
The new azo Schiff-base ligand was prepared by coupling reaction of diazonium salt with appropriate amount of 1-naphthol as coupling component in alkaline solution. Diazonium solution was prepared by dissolving 4.78 gm, 0.01 mol (N1Z,N2Z)-N1,N2-bis(4-amino-1,5-dimethyl-2-phenyl-1H-pyrazol-3(2H)-ylidene)benzene-1,2-diamine in 4 mL concentrated hydrochloric acid and 30 mL distilled water. To this mixture a solution of 1.4 gm , 0.02 mol sodium nitrate in 10 mL distilled water was added dropwise at 0-5 ℃, and left to stand 30 min. This diazonium solution was added dropwise to 1-naphthol (2.88 gm, 0.02 mol) dissolved in 50 mL ethanol and 60 mL sodium hydroxide (2N) at 0-5 ℃. The mixture was allowed to stand overnight. The precipitate was filtered off, washed with distilled water, and recrystallized twice from hot ethanol and then dried in oven at 50 ℃ for 12 h. MP = 173-175 ℃; yield = 80% (Scheme 2).
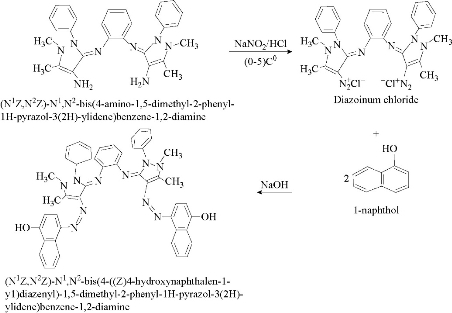
Scheme 2 Preparation of the azo Schiff-base ligand.
Preparation of metal complexes
The metal complexes were prepared by mixing 25 mL ethanol solution of FeCl3 2H2O, CoCl2 6H2O, NiCl2 6H2O, CuCl2 2H2O, ZnCl2, CdCl2 2H2O, HgCl2 2H2O, NaAuCl4 H2O with 25 mL ethanol solution of azo Schiff-base ligand in 1 : 1 (metal : ligand) ratio. The resulting mixture was refluxed for 1 h. The product was isolated after the volume was reduced by evaporation. It was filtered off, washed with ethanol and dried under vacuum. The complexes obtained are listed in Table 2.
Biological part
All chemicals and biological materials were supplied from Sigma, Difco, USA, Santacruze Biotechnology Inc, Europe, BDH, Flow Laboratories, GCC, UK, and Merk, Germany). Instruments were supplied from Arnold Sons, Genex, Beckman Model J2-21, Lab-TeK and Nunc, USA, Memmert, Hermle, Leica, Sartorius, Leitz, Germany, Marubeni, Ogawa Seiki, Japan, Gallen-Kamp, UK, Eppendroff, Oxford, LKB, Sweden, and Nunc, Denmark.
Cell culture media
Two types of cell culture media were used in this assay: Growth media (GM) and maintenance media (MM). The pH was checked and adjusted to about 6.8-7.1. The antibiotics were added to culture medium at final concentration of 100 IU/mL and 100 µg/mL of penicillin G and streptomycin, respectively (1 mL antibiotic solution to 100 mL culture medium). Nystatin was also added to give the final concentration of 25 IU/mL. Filtration of media was carried out in biohazard safety cabinet using 0.22 µm Millipore filter. To prepare 100 mL GM and MM, the components were mixed up to prepare media necessary for LS-174 cell line revealed in Table 1. Each bottle was sealed tightly, labeled with name, date, and kept in incubator at 37 ℃. The bottles were examined after 2-3 days later. If there were no turbidity and no indication of bacterial growth, they would be transferred to refrigerator to store till use.
Table 1 Constituents of cell culture media for LS-174 cell line
|
Components |
Growth media (mL) |
Maintenance media (mL) |
|
1X RPMI 1640 |
84.5 |
91.5 |
|
HEPES 1M |
2 |
2 |
|
Fetal calf serum (FCS) |
10 |
2 |
|
-- |
1 |
1 |
|
Nystatin |
1 |
1 |
|
NaHCO3 (7.5%) solution |
1.5 |
2.5 |
Cytotoxicity assay
Cell lines were seeded onto 96 well plates with a concentration of 1.0 × l05 cells/mL. After incubation at 37 ℃ for 24 to 48 h, the confluent monolayer of LS-174 cells was complete (80-100%). Different concentrations (0.5, 1, 10, 100, 1000, 2000, 3000, 4000, 5000 and 10000 µg/mL) of micro tittered Au(III) complex were added to cultured wells at a final volume of 100 µL in each well except control cells in triplicate. After 24 h, incubation at 37 ℃ in 5% CO2, the micro titer 96 wells plates were marched out and transferred to biohazard safety cabinet in sterilized environment to avoid any contamination. All used wells media were discarded. The LS-174 cell monolayers were washed by phosphate buffered saline (PBS) solution to remove any residual amount of complexes or standard anticancer drug used that might interact with methyl thiazolyl tetrazolium (MTT) reagents. Then, 100 µL maintenance media was added to all wells containing drug treated cells and drug untreated cells, and blank wells. Then, MTT reagent (20 µL) was added to each well. After 4 h of incubation at 37 ℃ and 5% CO2, the formazan particles were formed as a mitochondrial enzymatic process of the non-effected viable LS-174 cells. Dead or viral effected cells didn’t form formazan particles because their mitochondria organelles were disrupted. The formazan was dissolved by adding diluted DMSO: isopropanol at 1 : 1 ratio on each well including blank wells. The absorbance was read at 490 nm with a reference wavelength of 630 nm by an ELISA reader. This protocol of MTT assay measurement was mentioned by many reports [14, 15]. Mean blank absorption was subscribed from other samples and control well absorptions.
Results and Discussion
All our complexes were stable in air. They were freely soluble in DMSO, dimethylformamide (DMF), methanol and ethanol. The metal complexes were characterized by elemental analysis, molar conductivity, FTIR, UV-Vis and 1H-MNR spectroscopy. The analytical data of the complexes were in agreement with the experimental data (Table 2). The value revealed that the metal to ligand ratio was 1 : 1. The magnetic susceptibility of the chelate complexes at room temperature was consistent with octahedral geometry, except the Au(III) complex suggested a square planar geometry around the central metal ion. Most of the chelate complexes prepared in this work showed lower conductivity values compared to Au and Fe complexes. This proved that complexes had non-electrolytic nature, except the Au(III) and Fe(III) complexes which showed higher conductivity values supported the electrolytic nature of the metal complexes.
Micro analysis
The elemental analysis data of 1 : 1 metal :ligand (M : L) ratio complexes showed that the theoretical values were in good agreement with the found data, as listed in Table 2. The purity of azo Schiff-base ligand was tested by thin-layer chromatography(TLC) technique and CHN elemental analysis.
Table 2 Physical properties and elemental analysis of azo Schiff-base ligand and their metal complexes
|
Yield (%) |
Color |
M .Wt (gm/mol) |
MP (℃) |
M (%) Cal. /found |
N (%) Cal. /found |
H (%) Cal. /found |
C (% ) Cal. /found |
Compound |
|
80 |
Deep-red |
788 |
173-175 |
-- |
15.22 / 15.08 |
5.07 / 5.01 |
73.09 / 72.94 |
C48H40N10O2 = L |
|
85 |
Violet-reddish |
922.4 |
>310 |
6.88 / 6.57 |
15.17 / 15.06 |
4.33 / 4.21 |
62.44 / 61.56 |
Cu(L)Cl2 |
|
72 |
purple |
917.7 |
>310 |
6.39 / 6.25 |
15.25 / 15.18 |
4.35 / 4.22 |
62.76 / 61.87 |
Ni(L)Cl2 |
|
62 |
Violet-reddish |
917.9 |
>310 |
6.41 / 6.09 |
15.25 / 14.99 |
4.35 / 4.13 |
62.75 / 61.84 |
Co(L)Cl2 |
|
75 |
Violet-reddish |
924.3 |
140-141 |
7.07 / 6.88 |
15.14 / 14.89 |
3.69 / 3.18 |
62.31 / 62.01 |
Zn(L)Cl2 |
|
72 |
Violet-reddish |
971.4 |
238-240 |
11.57 / 10.76 |
14.41 / 13.96 |
4.11 / 4.09 |
59.29 / 58.66 |
Cd(L)Cl2 |
|
70 |
purple |
1059.5 |
260-262 |
18.92 / 18.12 |
13.21 / 12.79 |
3.77 / 13.21 |
54.36 / 53.86 |
Hg(L)Cl2 |
|
78 |
Violet-reddish |
950.3 |
>310 |
5.87 / 5.21 |
14.73 / 14.19 |
4.20 / 4.04 |
60.61 / 59.76 |
Fe(L)Cl2Cl |
|
82 |
Violet-reddish |
1091.4 |
128-130 |
18.04 / 17.92 |
12.82 / 12.22 |
3.66 / 3.46 |
52.77 / 52.21 |
Au(L)Cl3 |
Note: Cal. = calculated; M .Wt = molecular weight.
Infrared spectra studies of the ligand and its complexes
The FTIR spectra provided valuable information regarding the nature of the functional group attached to the metal atom. The most important infrared spectral bands that provided conclusive structural evidence for the coordination of the ligand to the central metal ions are given in Table 3. The FTIR spectrum of the ligand showed characteristic bands at 3419, 1639 and 1450/cm due to the O-H, C=N and N=N functional groups, respectively [16]. The IR spectra of the ligand exhibited appropriate shifts due to the formation of all complexes prepared in this study. The C=N and N=N bands in the free ligand shifted from 1639-1450/cm to 1630-1612/cm and 1444-1402/cm, respectively for the complexes. The reduction in bond order, upon complexion, could be attributed to the delocalization of metal electron density (t2g) to the ![]() -system of the ligand. These shifts confirmed the coordination of the ligand via the nitrogen of azo methine and the azo groups to metal ions [17]. The absorption band in free ligand observed at 3419/cm was attributed to the υ(OH) of hydroxyl group [18]. This band remained unchanged in the spectra of their complexes, which suggested that the hydroxyl group was not taking part in coordination [19]. New bands were attributed to υ(M-N) vibrations appearance in all complexes at 449-428/cm, respectively [20]. The stretching wave number due to N-N in the coordinated compound was slightly affected from 1024/cm, which indicated the unsharing of this linkage of pyrazolone ring in coordination with metal ions [21]. Representative example for their spectra is given in Fig. 1.
-system of the ligand. These shifts confirmed the coordination of the ligand via the nitrogen of azo methine and the azo groups to metal ions [17]. The absorption band in free ligand observed at 3419/cm was attributed to the υ(OH) of hydroxyl group [18]. This band remained unchanged in the spectra of their complexes, which suggested that the hydroxyl group was not taking part in coordination [19]. New bands were attributed to υ(M-N) vibrations appearance in all complexes at 449-428/cm, respectively [20]. The stretching wave number due to N-N in the coordinated compound was slightly affected from 1024/cm, which indicated the unsharing of this linkage of pyrazolone ring in coordination with metal ions [21]. Representative example for their spectra is given in Fig. 1.
Table 3 Characteristic IR absorption bands of the ligand and its complexes
|
Compound |
υ(O-H)/cm |
υ(N=N)/cm |
υ(C=N)/cm |
υ(N-N)/cm |
υ(M-N)/cm |
|
H(L) |
3419 |
1450 |
1639 |
1028 |
-- |
|
Cu(L)Cl2 |
3419 |
1406 |
1627 |
1022 |
449 |
|
Co(L)Cl2 |
3406 |
1409 |
1625 |
1024 |
449 |
|
Ni(L)Cl2 |
3412 |
1427 |
1620 |
1022 |
449 |
|
Fe(L)Cl2Cl |
3419 |
1435 |
1625 |
1022 |
430 |
|
Zn(L)Cl2 |
3412 |
1444 |
1627 |
1024 |
464 |
|
Cd(L)Cl2 |
3415 |
1409 |
1612 |
1024 |
428 |
|
Hg(L)Cl2 |
3423 |
1409 |
1630 |
1028 |
432 |
|
Au(L)Cl3 |
3400 |
1402 |
1627 |
1024 |
447 |
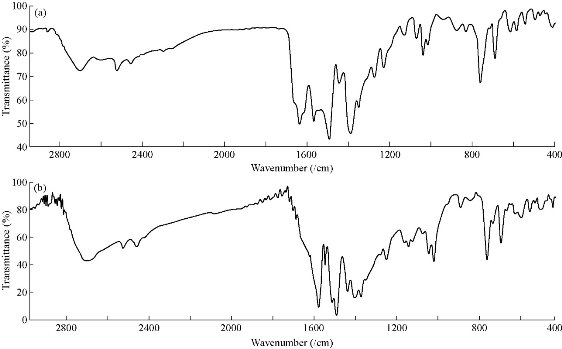
Fig. 1 FTIR spectra of (a) azo Schiff-base ligand and (b) Cu (II) complex.
Mass spectra
The mass spectra of synthesized azo Schiff-base ligand and its Cu(II) complex were recorded at room temperature. The obtained molecular ion peaks confirmed the proposed formulae for the synthesized compounds. The mass spectrum of the ligand shows the molecular ion peak at m/z 788.8 for the compound C48H40N10O2, confirming the proposed formula for the synthesized compound. Also The mass spectrum of the Cu(II) complex exhibited the molecular ion peak at m/z 922.5 for the molecular formula Cu(C48H40N10O2)Cl2, which was consistent with the molecular weight of the Cu(II) complex and in good agreement with their formula as expressed from micro analytical data. The mass spectral data fragmentation of the ligand and Cu(II)-complex are shown in Scheme 3, 4, and Fig. 2.
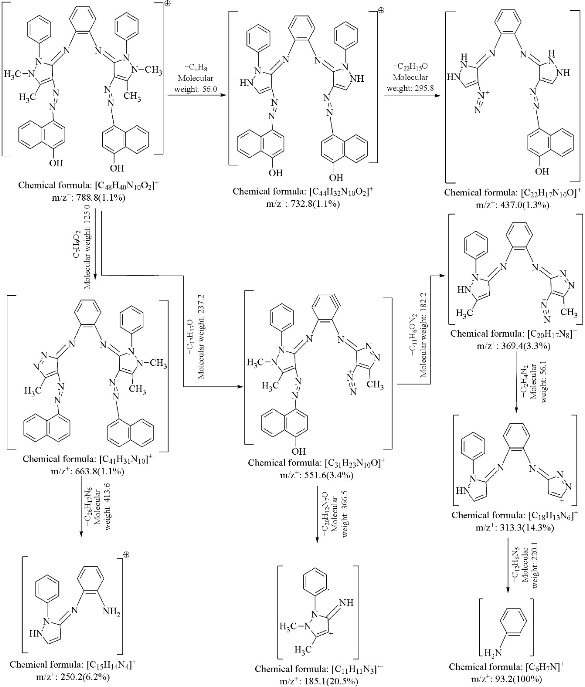
Scheme 3 Mass spectrum fragmentation of azo Schiff-base ligand.
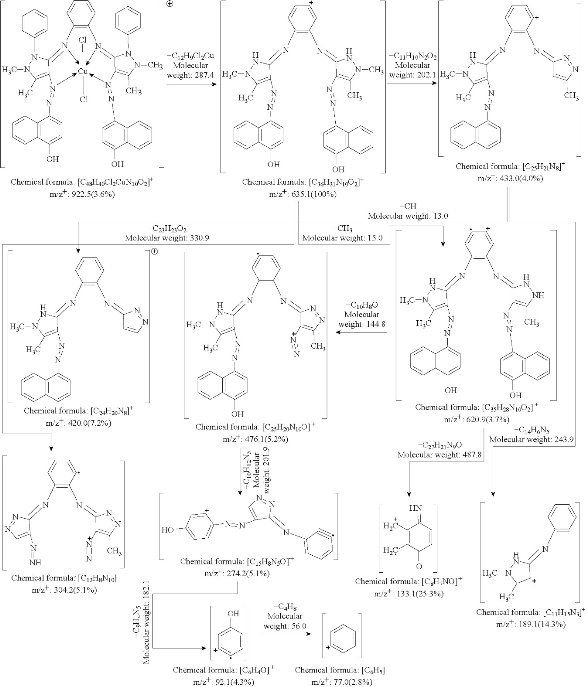
Scheme 4 Mass spectrum fragmentation of Cu- complex.
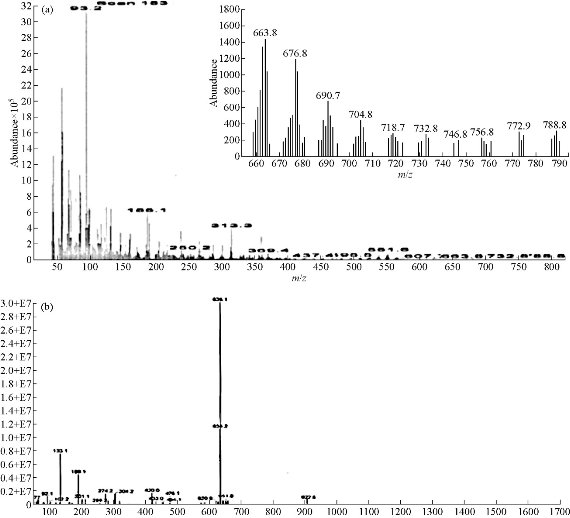
Fig. 2 Mass spectrum of (a) azo Schiff-base ligand and (b) Cu (II) complex.
1H-NMR spectra
The 1H-NMR spectrum of the ligand showed the following signals: Phenyl multiples at 6.8-8.7 ppm, =C-CH3 at 2.7 ppm, -N-CH3 at 3.3 ppm, and -OH at 10.6 ppm [6, 22]. This peak was noted in the spectra of complexes indicated that the –OH proton did not contribute to the complexity. There was no appreciable change in all other signals in the complexes, as shown in Fig. 3.
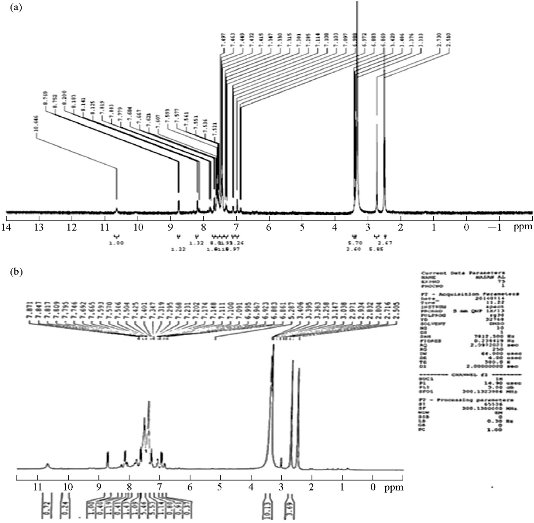
Fig. 3 1H-NMR spectrum of (a) azo Schiff-base ligand and (b) Zn (II) complex.
13C-NMR spectra
The 13C-NMR spectra of the azo Schiff-base ligand were measured at room temperature in DMSO-d6 as a solvent. The spectra of the ligand are shown in Fig. 4. The 13C-NMR spectrum of the ligand displayed characteristic signals at 11.3, 39.3,89 and 155.3 ppm due to >C–CH3, >N-CH3, >C-N=N- antipyrine ring and >C-OH naphthol ring of the Schiff base-azo ligand, respectively [8, 23]. The peak at δ = 163.3 ppm was due to azomethine carbon of the ligand [8]. Moreover, the spectrum of the ligand showed peaks in the region of 108.2, 109.9, 111.09, 122.1, 126.6, 127.6, 129.01 and 140.9 ppm due to aromatic carbon atoms.
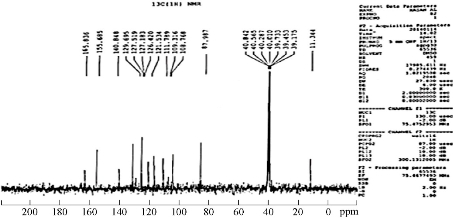
Fig. 4 13C-NMR spectrum of the azo Schiff-base ligand.
Electronic spectra
Electronic spectra provided the most detailed information about the electronic structure. The UV-Vis spectrum of the azo Schiff-base ligand exhibited two charge transfer (CT) bands at 316 nm 31645/cm and 412 nm 24271/cm, which was attributed to π–π* and n– π* transitions within the azo Schiff-base ligand. In the spectrum of the complexes, the CT band at 316 nm remained as such, in agreement with the π–π* transition of the azo Schiff-base ligand. The band observed at 412 nm in the spectrum of the free ligand (HL) was red-shifted to 449-549 nm in the complexes due to ligand to metal charge transfer (LMCT) transition [24], suggesting an octahedral geometry around metal(II) in the complexes [25]. The electronic spectra of the ligand and the Cu(II) complex are shown in Fig. 5. The electronic transitions, magnetic properties and conductivity values of the ligand and its complexes are listed in Table 4.

Fig. 5 Electronic spectrum of (a) ligand and (b) Cu(II) complex.
Magnetic measurements
The Fe(III) complex showed magnetic value at magnetic effect (μeff) = 5.4 B.M, which was consistent with an octahedral geometry [26]. The Co(II) complex had a magnetic moment of 4.91 BM, which was in agreement with the reported value for octahedral Co(II) complexes [27]. The present Ni(II) complex showed a magnetic moment value of 3.1 within the range of 2.9-3.3 BM [25, 28], suggesting an octahedral environment. The Cu(II) complex showed a magnetic moment value of 1.82 BM, higher than the spin-only value 1.73 BM as expected for one unpaired electron, which was monomeric and consistent with a distorted octahedral geometry [29]. The Zn(II), Cd(II), Hg(II), Au(III) were diamagnetic and according to the empirical formulae of complexes. An octahedral geometry was proposed [30], except the Au(III) complex suggested a square planar geometry around the central metal ion [31]. Based on the above results, we could deduce the probable structures of the complexes as shown in Fig. 6.
Table 4 Electronic spectra, conductivity and magnetic moment of complexes
|
Compound |
Absorption Bonds (nm) |
Absorption Bonds (/cm) |
Transition |
µeff (BM) |
Conductivity (S cm2/mol) |
Geometry |
Hybridization |
|
H(L) |
316 412 |
31645 24271 |
π→π* n→π* |
-- |
-- |
-- |
-- |
|
Fe(L)Cl2Cl |
512 |
19531 |
M→L,CT |
5.4 |
35 |
Octahedral (regular) |
sp3d2 |
|
Co(L)Cl2 |
549 |
18214 |
M→L,CT |
4.91 |
9 |
Octahedral (distorted) |
sp3d2 |
|
Ni(L)Cl2 |
449 |
22271
|
M→L,CT
|
3.1 |
15 |
Octahedral (regular) |
sp3d2 |
|
Cu(L)Cl2 |
539 |
18552 |
M→L,CT |
1.82 |
12 |
Octahedral (distorted) |
sp3d2 |
|
Au(L)Cl3 |
540 |
18518 |
M→L,CT |
Diamagnetic (Dia) |
195 |
Square- planar |
dsp2 |
|
Zn(L)Cl2 |
508 |
19685 |
M→L,CT |
Dia |
6 |
Octahedral (regular) |
sp3d2 |
|
Cd(L)Cl2 |
512 |
19531 |
M→L,CT |
Dia |
13 |
Octahedral (regular) |
sp3d2 |
|
Hg(L)Cl2 |
516 |
19379 |
M→L,CT |
Dia |
11 |
Octahedral (regular) |
sp3d2 |
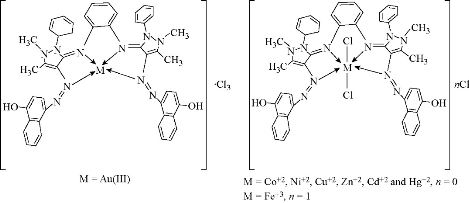
Fig. 6 Proposed structural formulae of the complexes.
Anticancer activity
Evaluation of newly synthesized complexes in cancer therapy were studied. In this study the antitumor activities of the synthesized Au(III) complex were tested against colon cancer (disease: Dukes' type B, colorectal adenocarcinoma) LS174 cell line. The results showed that the highest inhibitory effect was reported for complex, giving the IC50 value as of 465. The cell cytotoxic effect of the tested Au(III) complex was calculated. The optical density was measured with the micro plate reader to determine the number of viable cells, and the percentage of viability was calculated as
[1-(ODt/ODc)] × 100%, (1)
where ODt is the mean optical density of wells treated with the tested sample and ODc is the mean optical density of untreated cells. The relation between surviving cells and drug concentration was plotted to get the survival curve of each tumor cell line after treatment with the specified complex. The 50% inhibitory concentration (IC50), the concentration required to cause toxic effects in 50% of intact cells, was estimated from graphic plots of the dose response curve for each concentration using Graph pad Prism 6. The anticancer activity of the synthesized Au(III)complex was determined against an colon cancer LS-174 cell line using different concentrations, evaluated and compared with the standard drug doxorubicin (DOX). The gold complex exhibited good results compared with the standard DOX. The in-vitro inhibitory activity of the tested gold complex against colorectal carcinoma LS-174 cells was expressed as IC50 value (μg/mL). The results are shown in Table 5, 6, Fig. 7 and 8. The cytotoxicity of Au(III) complex on normal cells, i.e. rat embryo fibroblast cell line (REF) was studied using methyl thiazolyl tetrazolium (MTT) assay. The results indicated the effect of toxicity was very low. The results are shown in Fig. 9. The positive charge of the metal increased the acidity of coordinated ligand that bore protons, leading to stronger hydrogen bonds which enhanced the biological activity [32]. Moreover, Gaetke and Chow had reported that, metal has been suggested to facilitate oxidated tissue injury through a free-radical mediated pathway analogous to the Fenton reaction [33]. By applying the electron spin resonance (ESR trapping technique, evidence for metal-mediated hydroxyl radical formation in vivo has been obtained [34]. Reactive oxygen species (ROS) was produced through a Fenton-type reaction as follows:
LM(II) + H2O2 → LM(I) + .OOH + H+, (2) and
LM(I) + H2O2 → LM(II) + .OH + OH-, (3)
where L refers to the organic ligand.
Also, metal could act as a double-edged sword by inducing DNA damage and also by inhibiting their repair [35]. The OH radicals reacted with DNA sugars and bases, and the most significant and well-characterized of the OH reactions was hydrogen atom abstraction from the C4 on the deoxyribo to yield sugar radicals with subsequent β-elimination (Scheme 5). By this mechanism strand break occurred as well as the release of the free bases. Another form of attack on the DNA bases was by solvated electrons, probably via a similar reaction to those discussed below for the direct effects of radiation on DNA [35].
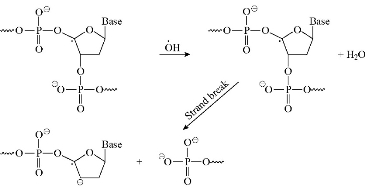
Scheme 5 Mechanism of Fenton reaction.
Table 5 The percentage of inhibition and Log x for the Au(III) complex
|
x = conc. (µg/mL) |
0.5 |
1 |
10 |
100 |
1000 |
2000 |
3000 |
4000 |
5000 |
10000 |
|
Log x |
0 |
0 |
1 |
2 |
3 |
3.3 |
3.5 |
3.6 |
3.7 |
4 |
|
Inhibition (%) |
14.7 |
18.8 |
24.9 |
26.5 |
26.9 |
34.6 |
44.5 |
61.5 |
64.5 |
66.0 |
|
y = 40.35; Log IC50 = 2.668; IC50 = 465.58 |
||||||||||
Note: Conc. = concentration; y = statistical value; IC50 = 50% inhibitory concentration.
Table 6 The percentage of inhibition and Log x for the DOX drug
|
x = conc. (µg/mL) |
0.5 |
1 |
10 |
100 |
1000 |
|
Log x |
0 |
0 |
1 |
1.7 |
2 |
|
Inhibition (%) |
24.6 |
25.8 |
27.6 |
35.1 |
50.4 |
|
y = 37.5; Log IC50 = 1.503; IC50 = 31.8 |
|||||
Note: Conc. = concentration; y = statistical value; IC50 = 50% inhibitory concentration.

Fig. 7 Curve with plotting of lC50 of (a) doxorubicin drug and (b) Au(III) complex.
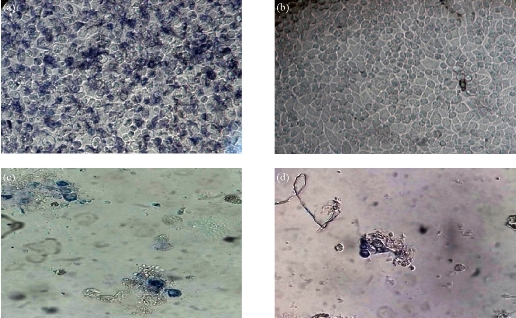
Fig. 8 (a) Untreated cell with MTT; (b) untreated cells; (c) and (d) treated cells with gold complex in conc. = 1000 and 2000 µg/mL.
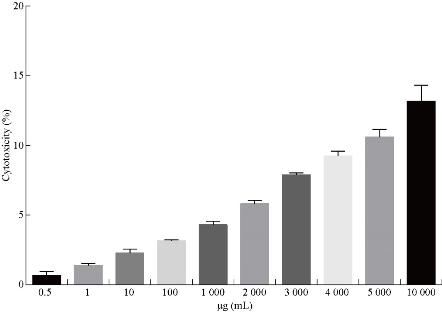
Fig. 9 Determination of the cytotoxic effect on REF.
Conductivity measurement
Most of the chelate complexes prepared in this work showed the conductivity values ranged between 73-80 S cm2/mol in DMSO at room temperature, which were very low values [25] compared with the high values of conductivity of both Au(III) and Fe(III) complexes [31]. This could support the electrolytic nature of the metal complexes. According to these results, the structural formulae of these ligand and complexes may be proposed in Fig. 6.
Conclusions
In this paper we explored the synthesis and coordination chemistry of some monomeric complexes obtained from the reaction of the tetra dentate ligand (L) with some metal ions as shown in Fig. 6. The mode of bonding and the overall structure of the complexes were determined through physico-chemical and spectroscopic methods. Complex formation study via molar ratio was investigated and results were consistent with those found in the solid complexes with a ratio of M : L = 1 : 1. The biological screening effect of the gold complex was tested against human colon cancer cell line LS-174. The results showed the highest inhibitory effect for the complex.
Conflict of Interests
The authors declare that no competing interest exists.
References
Copyright© Layla Ali Mohammed, Raheem Tahir Mehdi, and Abid Allah Mohammed Ali. This is an open-access article distributed under the terms of the Creative Commons Attribution License, which permits unrestricted use, distribution, and reproduction in any medium, provided the original author and source are credited.