Research Article
Copper Metal at New CuO Nanoparticles Modified Carbonpaste Electrode: Selective Voltammetric Determination
Amer Mousa Jouda, Emad Salaam Abood *, Mothana Salih Mashloor
Department of Chemistry, Faculty of Science, University of Kufa, 54001 AnNajaf, Iraq.
* Corresponding author. E-mail: amadiraq45@gmail.com
Received: May 5, 2018; Accepted: Jul. 12, 2018; Published: Aug. 20, 2018
Citation: Amer Mousa Jouda, Emad Salaam Abood, and Mothana Salih Mashloor, Copper Metal at New CuO Nanoparticles Modified Carbonpaste Electrode: Selective Voltammetric Determination. Nano Biomed. Eng., 2017, 10(3): 243-249.
DOI: 10.5101/nbe.v10i3.p243-249.
Abstract
A new carbon paste electrode modified with CuO nanoparticles was prepared, and used to study the electro oxidation of copper ions in solution by cyclic voltammetry (CV) method. The modified electrode displayed strong resolving function for the overlapping voltammetric response of copper into one well-defined peak. The potential difference between Epa and Epc was > 200 mV; this range referred to the quise-reversible mechanism. The kinetic of electrode was studied at the temperature range from 15 ~ 35 oC; the data of voltamograms showed the increase of temperature caused increase of negative shift, which suggested the diffusion electron transfer in the redox process of copper oxidation. Diffusion coefficient was calculated from the Randles–Sevcik equation and was equal to 71.8 × 10⁻⁴; the rate constant K was equal to 8.8 × 10⁻⁷; the peak current of copper increased linearly with its concentration at the range of 0.2 ~ 2.0 ppm.
Keywords: Cyclic voltammetry; Nanoparticles; Electrodes
Introduction
Drug analysis plays an important role in drug quality control, and has great impact on public health. Therefore, a simple, sensitive and accurate method for the determination of active ingredient is a crucial step [1]. Copper is an essential trace element that is vital to the health of all living beings (humans, plants, animals and microorganisms). In humans, copper is essential for the proper functioning of organs and metabolic processes. The human body has complex homeostatic mechanisms which attempt to ensure a constant supply of available copper, while eliminating excess copper whenever it occurs. However, like all essential elements and nutrients, too much or too little nutritional ingestion of copper can result in corresponding conditions of copper excess or deficiency in the body, each of which has its own unique set of adverse health effects. Copper deficiency and toxicity can be either of genetic or non-genetic origin [2]. Copper is found in cells throughout the body; it helps our bodies make red blood cells and keeps nerve cells and our immune systems healthy. It also helps to form collagen, a key part of bones and connective tissues. Copper may also act as an antioxidant, reducing free radicals that can damage cells and DNA. Copper helps the body absorb irons. Our bodies need copper to make energy [3]. Thus, a quantitative determination of copper concentration is significant for developing immune physiological and pharmacological research and life sciences. There are some methods applied to the determination of copper, such as flow injection [4], fluorimetry [5] and spectrophotometry method [6]. As an electro active device, it can also be studied via electrochemical techniques. Some reports showed the electrochemical response of copper on copper oxide nanoparticle carbon paste electrode [7-8]. The electrochemical methods using chemically modified electrode have been widely used in sensitive and selective analytical methods for the detection of the trace amounts of biologically important compounds [9-11]. Electrode surface can be modified with metal nanoparticles and such surfaces have found numerous applications in the field of bio electrochemistry, particularly in biosensors. It has also been observed that nanoparticles can act as conduction centers facilitating the transfer of electrons. In addition, they provide large catalytic surface area. Many kinds of nanoparticles, including metal nanoparticles, oxide nanoparticles, semiconductor nanoparticles and composite nanoparticles have been widely used in electrochemical sensors and bio sensors [12-14]. Copper is electro active component that can be determined electrochemically [15]. However, it is very difficult to distinguish their response signal at bare electrodes because of their similar potential and interference from each other. Therefore, it is very important to develop a modified electrode to resolve their voltammetric response from each other. To the best of our knowledge, no study has been reported so far on the simultaneous determination of copper by using the carbon paste electrode modified with the CuO nanoparticles. In this study, we report the preparation and application of a carbon paste electrode modified with CuO nanoparticles for the determination of copper ion without any addition modification such as addition of electron transfer mediator or specific reagent for the first time [16].
Experimental
Apparatus and chemicals
The electrochemical measurements were performed with an auto lab potentiostat (Digi-ivy 2113 Texas, USA) controlled by the general purpose electrochemical system software. The CuO nanoparticle carbon paste electrode was used as the working electrode. A calomel electrode and a platinum (Pt) wire were employed as the reference electrode and counter electrode, respectively, and all potentials were reported with respect to the former. A metrohm pH/ion meter was used for pH measurements. All solution were freshly prepared with doubly-distilled water (conductivity of water was 0.055 µS/cm). All reagents were of analytical grade from Merck. Graphite powder and paraffin oil (density 350, 0.88 g/cm3) were both from Merck, used as received. High dilution acid-base was in the pH range of 2.0 ~ 8.0. All solutions were deoxygenated with pure nitrogen gas for about 20 min prior to each electrochemical experiment [17].
Preparation of CuO nanoparticle by hydro-thermal method
CuO nanoparticles were synthesized by hydrothermal method. Typically, 10 g of CuCl2 was dissolved in 200 mL of distilled water, and then a solution containing 8 g of NaOH was slowly added with stirring. After 8 h, a dark brown precipitate was obtained. The resulting precipitate was washed with distilled water and dissolved again in water to get solution A, which was mixed with 50 mL of poly vinyl Polyline (PVP) solution B (13 g of PVP dissolved in water) solution during a continuous stirring to get a homogeneous solution. The homogeneous solution was transferred into autoclave and heated at 160 oC for 8 h. Then, CuO powder was obtained and dried at 100 oC after it had been washed with distilled water. The morphology of the synthesized CuO nanoparticle sample was studied by scanning electron microscopy (SEM) by using SEM Inspect S50 (Fig. 1). The SEM image showed the agglomerated CuO nanoparticles had an average size of less than 350 nm [18].
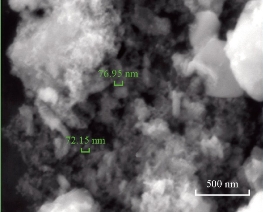
Fig. 1 Scanning electron microscopy (SEM) image of CuO nanoparticles.
Preparation of the electrode
The CuO modified carbon paste electrodes were prepared by mixing 0.05 g of CuO nanoparticles, 0.7 g graphite powder and 0.4 mL of paraffin oil with a mortar and pestle until a uniform paste was obtained. The paste was packed into the end of a glass tube (diameter 0.44 mm length and 10 cm long). The electrical contact was provided by inserting a copper wire into the carbon paste. Prior to the experiment, the surface of the carbon paste was polished with fine paper. The unmodified carbon paste electrode was prepared in the same way without adding CuO nanoparticles to the paste.
Results and Discussion
Cyclic voltammetry study of copper
Fig. 2 depicts the cyclic voltammetric response for the electrochemical oxidation-reduction of 0.1M CuSO4 at CuO nanoparticle carbon paste electrode (curve (b)). The anodic peak potential for the oxidation of Cu2+ was about -0.615 V, and the reduction peak was about 1.110 V, but no peak appeared on the carbon paste electrode (curve (a)). In other words, the result clearly indicated that the combination of graphite powder and CuO nanoparticle improved the copper oxidation signal. The effect of scan rate on the electro-oxidation of copper at the CuO nanoparticle carbon paste electrode was investigated by cyclic voltammetry (CV) (Fig. 3 and 4). A plot of peak current (Ip) versus the square root of scan rate (ʋ1/2), in the range of 0.01 ~ 5 V/s was non-linear with more negative shifts. It suggested that, at sufficient over potential, the process was diffusion rather than surface controlled [19].
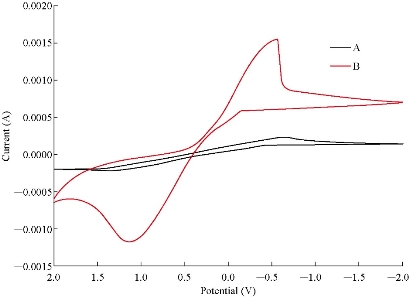
Fig. 2 Cyclic voltammograms of (a) carbon passed electrode and (b) CuO nanoparticle carbon paste electrode and in 0.1 M CuSO4 solution at the scan rate 0.1 V/s.
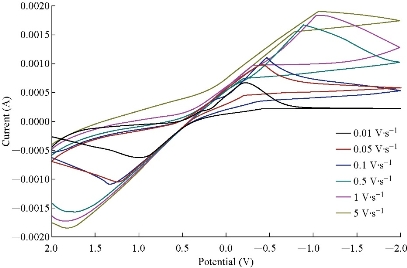
Fig. 3 Cyclic voltammogram of CuO nanoparticle electrode in the presence of 0.1M of CuSO4 solution at different scan rates as of 0.01, 0.05, 0.1, 0.5, 1 and 5 V/s, respectively.
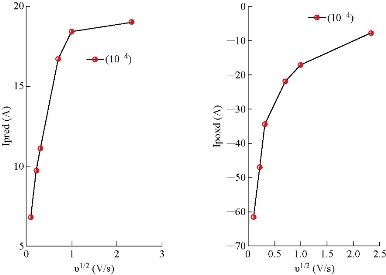
Fig. 4 Ip oxidation (Ipoxd) and ip redaction (Ipred) peaks versus ʋ1/2 for Cu2+.
Temperature dependence studies on the electro-oxidation of CuO nanoparticle electrode
A study of the electro-oxidation on electrodes has been investigated by CV, in the temperature range between 15 oC and 35 ºC. The variation of the cyclicvoltammograme allowed the determination of activation energy in a wide interval of potentials where characteristic oxidation peaks appeared. Stationary current intensity measurements allowed the determination of the activation energy in pure kinetic region conditions. Temperature dependence of the charge-transfer resistance and the rate constant associated with the surface coverage by a diffusion intermediate during the electro-oxidation process were evaluated and discussed. It was suggested that a complex mechanism took place for the electro-oxidation free of strong interactions with the CuO nanoparticle electrode surface [19-20]. The result suggested the working electrode tracked the clear signal, at 25 oC, by using equation (1):
lnD = ln (D0- ![]() (1)
(1)
where D is diffusion constant, D0 is standard diffusion constant, Ea is activated energy, R is universal gas constant, and T is temperature, respectively. From the slope between lnD and 1/T (K) that is shown in Fig. 5, the free energy was calculated as Ea = -4.986 (kJ/mol). The result suggested that the exothermic reaction accrued when potential was provided on the working electrode, also by using equation (2):
∆G = -nFR(∆Ep), (2)
where ∆G is free energy, n is number of electrons, F is faraday constant, R is universal gas constant, and ∆Ep is potential. The free Gibbs energy was determined as of 49.69 kJ/mol, which referred to the spontaneous reaction. From the last result, the constant of reaction Keq was calculated by using Nicholson equation:
K = Ko exp![]() (E - Eo), (3)
(E - Eo), (3)
where K is reaction rate constant; Ko standard reaction constant; -∝ is transition coefficient; F is faraday constant, R is universal gas constant; T is temperature, E is potential, and Eo is standard potential. The rate constant equal to 8.8-10-7 /s for the quasi-reversible reaction of cyclic voltammetry referred to the first-order reaction. Table1shows all the kinetic and thermodynamic parameters.
Table 1 Kinetic and thermodynamic parameters of CuO nanoparticle electrodes
|
Type of electrode |
∆E (kJ/mol) |
∆H (kJ/mol) |
∆G (kJ/mol) |
∆S (J/mol) |
Keq (cm/s) |
D (× 10-4) |
α |
|
CuO nanoelectrod |
-4.986 |
-67.3 |
49.69 |
166.5 |
8.8-10-7 |
71.8 |
0.35 |
Note: ∆E = activated energy; ∆H = enthalpy; ∆G = free energy; ∆S = entropy; Keq = rate constant; D = diffusion coefficient; α = transition coefficient.
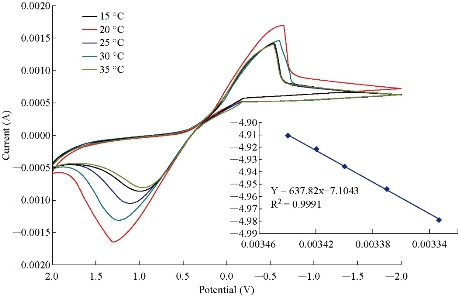
Fig. 5 Effect of temperature on the cyclic voltammogram of CuO nanoparticle electrode with different temperatures as of 15, 20. 25. 30 and 35 °C, respectively. And the ln(D-1/T(K)) plot for the calculation of Ea energy for CuO nanoparticle electrode. D: Diffusion coefficient; T: Temperature; K: Rate constant; Ea: Activated energy.)
Calibration plots and determination of zinc at CuO nanoparticle carbon paste electrode
CV was used to obtain the analytical features of the method such as linear ranges of the calibration plots, and to detect the limits for Cu2+. The capability of separating the electrochemical response of Cu2+ by CuO nanoparticle modified electrode was studied. Therefore, CV was used for the simultaneous separation of species based on its superior elimination of the capacitive background current. Analytical experiments were carried out by varying concentrations of CuSO4 pure stock solution with pH = 7.0 by using CuO nanoparticle electrode. Fig. 6 and 7 show the calibration curve by CV obtained in 0.2 ~ 2 ppm. The response of the CuO nanoparticle to Cu2+ could be clearly seen. Table 2 and 3 show the results of stock solution and real sample of copper (Hasanl A-Z Vital , Germany) containing vitamins A, D, C and E, steroid, folic acid, zinc, copper, iron and manganese with the percentage ratio as of 40, 20, 15, 10, 5, 5 and 5% prepared by using equation 4:
w.t = ![]()
where w.t refers to weight; ppm refers to concentration; M.wt refer to molecular weight; V refers to volume. All results suggested that the CuO electrode was more sensitive, speedy, economical, clearer and safer than the colorimetric and atomic analyzer for determination of trace amount in drug component.
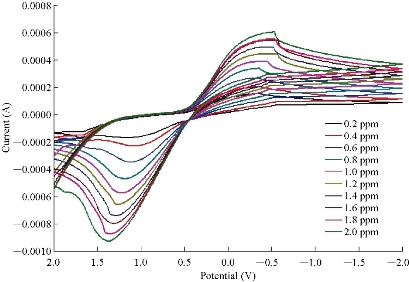
Fig. 6 Voltammogram and calibration curve of CuSO4 solution by using CuO nanoparticle electrode.
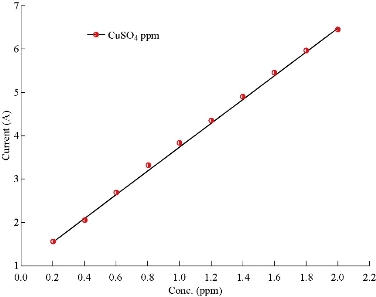
Fig. 7 Calibration curve of CuSO4 solution by using CuO nanoparticle electrode for CuSO4 stock solutions.
Table 2 Results determined for the real sample of drug by different methods
|
Theoretical value (ppm) |
RSD (%) |
Concentration determined in real sample (ppm) |
Linear range of the method (ppm) |
Analyte: Cu (mg) |
Method |
|
|
|
|
10-3 ~ 10+3 |
|
Cyclic voltammetry |
|
0.5 |
58.0 |
0.29 |
|
0.5 |
|
|
1.5 |
73.3 |
1.10 |
|
1.5 |
|
|
2.0 |
77.0 |
1.54 |
|
2 |
|
|
|
|
|
0.8 ~ 50 |
|
Colometry |
|
0.5 |
20.0 |
0.1 |
|
0.5 |
|
|
1.5 |
60.0 |
0.9 |
|
1.5 |
|
|
2.0 |
60.0 |
1.2 |
|
2 |
|
|
|
|
|
0.1 ~ 10+3 |
|
Atomic radiation |
|
0.5 |
56.0 |
0.28 |
|
0.5 |
|
|
1.5 |
66.6 |
1.00 |
|
1.5 |
|
|
2.0 |
76.5 |
1.53 |
|
2 |
|
Table 3 Results determined for the stock solution by different methods
|
Theoretical value (ppm) |
RSD (%) |
Concentration determined in stock solution (ppm) |
Linear range of the method (ppm) |
Analyte: Cu (mg) |
Method |
|
|
|
|
10-3 ~ 10+3 |
|
Cyclic voltammetry |
|
0.5 |
94.0 |
0.47 |
|
0.5 |
|
|
1.5 |
92.6 |
1.39 |
|
1.5 |
|
|
2.0 |
95.5 |
1.91 |
|
2 |
|
|
|
|
|
0.08 – 5 |
|
Colometry |
|
0.5 |
84.0 |
0.42 |
|
0.5 |
|
|
1.5 |
91.3 |
1.37 |
|
1.5 |
|
|
2.0 |
94.5 |
1.89 |
|
2 |
|
|
|
|
|
0.1 -10+3 |
|
Atomic radiation |
|
0.5 |
94.0 |
0.47 |
|
0.5 |
|
|
1.5 |
92.0 |
1.38 |
|
1.5 |
|
|
2.0 |
95.0 |
1.90 |
|
2 |
|
Conclusions
Nano copper oxide is a highly sensitive and selective vehicle that senses the small changes in the current passing through its solution when it becomes an electrode. Therefore, in this study, it was used to prepare the electrode and to study its physical and chemical properties and applied to measure the small concentrations of drugs containing copper, The results were highly accurate in standard solutions and in real sample when compared to common methods such as atomic analyzer and colorimetric method.
Conflict of Interests
The authors declare that no competing interest exists.
References
Copyright© Amer Mousa Jouda, Emad Salaam Abood, and Mothana Salih Mashloor. This is an open-access article distributed under the terms of the Creative Commons Attribution License, which permits unrestricted use, distribution, and reproduction in any medium, provided the original author and source are credited.