Research Article
Effect of Human MTHFR Gene Polymorphisms in Morbidly Obese Population on Elevate Risk of Type 2 Diabetes
Fatimah Sahib Abed 1*, Hanaa Addai Ali 1, Omid Ranaei Siadat 2, Fataneh Fatemi 2, Sareh Arjmand 2
1 Department of Chemistry, Faculty of Science, University of Kufa, Najaf, Iraq.
2 Protein Research Center, University of Shahid Beheshti, GC, Tehran, Iran.
* Corresponding author. E-mail: dr.Fatimas.abd@gmail.com
Received: May 24, 2018; Accepted: Aug. 24, 2018; Published: Nov. 12, 2018
Citation: Fatimah Sahib Abed, Hanaa Addai Ali, Omid Ranaei Siadat, Fataneh Fatemi, and Sareh Arjmand, Effect of Human MTHFR Gene Polymorphisms in Morbidly Obese Population on Elevate Risk of Type 2 Diabetes. Nano Biomed. Eng., 2018, 10(4): 362-368.
DOI: 10.5101/nbe.v10i4.p362-368.
Abstract
In this paper, based on the association of methylenetetrahydrofolate reductase (MTHFR) with type 2 diabetes (T2D), we evaluated the association of polymorphism with morbidly obesity on risk type 2 diabetes. A case-control study of 74 health morbidly obese and 76 healthy non-obese was conducted in Iraq. MTHFR (C677T, A1298C and G1793A) genotyping was performed by polymerase chain reaction-restriction fragment length polymorphism (PCR-RFLP). The study revealed a significant association between cytidine/thymine (CT) genotype of C677T and morbid obesity (odds ratio (OR): 1.26, 95% confidence interval (CI): 0.91-1.60, probability (P) = 0.0003), but did not show any significant association in thymine/thymine (TT) genotype (OR: 0.258, 95% CI: 0.88-1.60, P = 0.082). On the other hand the second single nucleotide polymorphism (SNP) A1298C showed highly significant association in adenine/adenine (AA) genotype (OR: 1.39, 95% CI: 0.91-1.58, P = 0.0001) and significant association between adenine/cytidine (AC) and cytidine/cytidine (CC) genotypes (OR: 0.702, 95% CI: 0.88-1.61, P = 0.0377), (OR: 0.844, 95% CI: 0.91-1.59, P = 0.0273), respectively, but showed no significant relation in three types of normal homozygous, heterozygous and rare homozygous in MTHFR-G1793A. The results suggested that A1298C substitution might pose a direct effect on being type 2 diabetes in morbidly obese patients, and C677T had moderate effect, while G1793A had no effect. However, further case-control studies are required to provide a more robust conclusion.
Keywords: MTHFR; (C677T); (A1298C); (G1793A); Morbidly obese; Type 2 diabetes; Hyperhomocysteinemia (HHcy)
Introduction
More than 400 million people had diabetes in 2015 and the number is being elevated in almost all the world [1]. Iraq is considered one of the countries that have a large number of diabetic patients and a large number of obese people. In present studies on morbid obesity, methylenetetrahydrofolate reductase (MTHFR) has been suggested as the gene and measured level of insulin to study the association between cardiovascular disease and type 2 diabetes (T2D) [2-5]. MTHFR is the enzyme involved in homocysteine (HHcy) metabolism, catalyzing the conversion of 5, 10-methylenetetrahydrofolate to 5-methyltetrahydrofolate [6]. Accumulative data in the past years show that HHcy is associated with an increased risk of T2D [7-9]. Two factors effected on HHcy, the gene and the environment, at the MTHFR gene, substituting T to C (C677T), C To A (A1298C) and A to G (G1793A), have been studied and verified to decrease the enzyme activity in methylation cycle, cause accumulation of HHcy, especially when folate is not enough in food [10-13]. Some studies showed specific relationship between MTHFR and T2D, and it was a significantly positive association [3, 5, 14-19]. The interaction between family history of diabetes and obesity on the risk of T2D implied that there might be an association of obesity with the susceptibility gene of T2D; some studies indicated that HHcy could induce insulin resistance in adipose tissue [20-23]. Our identification described the mechanism of correlation between HHcy related genetic variants and T2D risk that may contribute to morbid obesity.
Experimental
The study population consisted of 74 morbidly obese cases and 76 non-obese cases as control, and both of the two groups were matched according to age and gender. National standard techniques were used for the two groups to measure the weight and the height; body mass index (BMI) was calculated as body weight in kg divided on square of height in m2. BMI < 24.9 was classified as normal, 25 < BMI > 29.9 was classified overweight, 30 < BMI > 34.9 was obese, and BMI > 35 was classified morbidly obese. Systolic and diastolic blood pressure was measured one time for all study subjects. After 12 h fasting, venous blood samples were collected from all the participants for genetic and biochemical analysis. The fasting blood sugar (FBS), total cholesterol (TC), triglyceride (TG), very low density lipoprotein cholesterol (VLDL-C), low density lipoprotein cholesterol (LDL-C), high density lipoprotein cholesterol (HDL-C), insulin, and insulin resistance were measured for two groups.
Genotype
Genomic DNA was extracted from whole blood using ROJE DNA Extraction Kits. The genotype of MTHFR C677T was determined by polymerase chain reaction (PCR)-restriction fragment length polymorphism (RFLP) using forward and reverse primers 5´-TGAAGGAGAAGGTGTCTGCGGGA-3´, 5´-AGGACGGTGCGGTGAGAGTG-3´, respectively [24]. PCR mixture was 25 µL in total volume, containing of 12.5 µL master mix, 1 µL from each forward and reverse primer and 2 µL (250 ng) of template DNA. The PCR condition, denatured at 95 ºC for 10 min and followed by 30 cycles for 1 min at 95 ºC, 40 sec at 62 ºC and 40 sec at 72 ºC, with 10 min at 72 ºC for elongation step at the end of cycles as shown in Fig. 1. The PCR product was electrophoresed in 3% agarose gel, and then digested with HinfI restriction enzyme. When the product of digestion was electrophoresed for the genotype MTHFR C677T, the result was single fragment of 198 bp for normal homozygous CC, three fragments of 198, 175 and 23 bp for heterozygous CT, and two fragments of 175 and 23 bp for rare homozygous TT (Fig. 2). The A1298C-MTHFR polymorphism was genotyped with PCR that digested the amplified product by MboII restriction enzyme. Briefly, the forward and revers primers used for amplification of DNA fragment 163 bp were 5´-CTTTGGGGAGCTGAAGGACTACTA-3´ and 5´-CACTTTGTGACCATTCCGGTTTG-3´, respectively [25]. The PCR mixture and thermal profile were the same as those in C677T, except that the annealing temperature was 60 ºC for 40 s (Fig. 3). The product of digestion was electrophoresed on 4% agarose gels. The result was 5 fragments for homozygous normal allele AA with the sizes of 56, 31, 30, 28 and 18 bp, 3 fragments for the heterozygous AC with the sizes of 84, 56 and 30 bp, whereas the rare homozygous CC produced 4 fragments with the sizes of 84, 31, 30 and 18 bp. Finally, the MTHFR-(G1793A) was also genotyped with the same technic (PCR). MTHFR fragment was amplified by using 5´-TGATGCAGGGTGTTTATTTCTGG-3´ as the forward primer and 5´-AGTCTAGCTGCCATTGTCAGGTG-3´ as the revers primer, in annealing temperature equal to 62 ºC (Fig. 4). The product was digested by BsrbI restriction enzyme and electrophoresed by using 3% agarose gels. The result was 2 fragments for GG genotype of 335 and 193 bp, 3 fragments for GA genotype of 528, 193 and 335 bp, and 1 band for AA genotype of 528 bp [26] (Fig. 5).
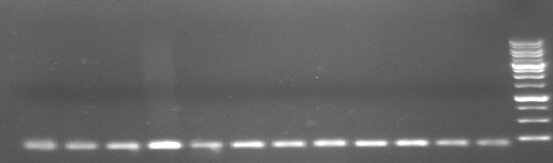
Fig. 1 PCR product of MTHFR gene polymorphism (single nucleotide polymorphism (SNP), C677T) (rs868014) analyzed by agarose gel electrophoresis on 3% agarose. DNA markers: 100 bp molecular weight; PCR product: amplicon size 198 bp.
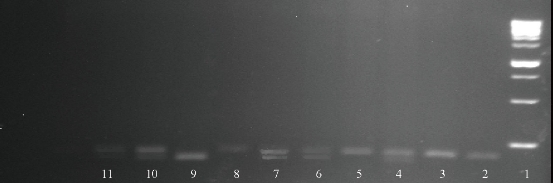
Fig. 2 PCR product of MTHFR gene digested with HinfI restriction enzyme. The product of digestion was electrophoresed on 3% agarose. DNA markers: 100 bp molecular weight. Line (1) DNA ladder: 100 bp molecular weight; Line (2), (3), (5) and (8) CC genotype: 198 bp; Line (4), (6), (7), (10) and (11) genotype CT: 198, 175 and 23 bp; Line (9) TT genotype: 175 and 23 bp.
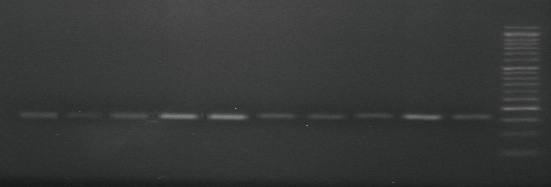
Fig. 3 PCR product of MTHFR gene polymorphism (single nucleotide polymorphism (SNP), A1298C) (rs868014) analyzed by agarose gel electrophoresis on 3% agarose. DNA markers: 50 bp molecular weight; product of amplification size: 163 bp.
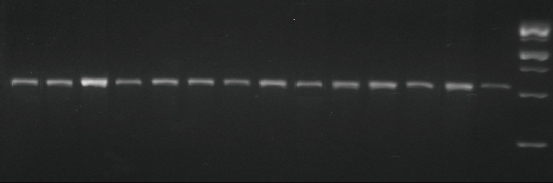
Fig. 4 PCR product of MTHFR gene polymorphism (single nucleotide polymorphism (SNP), G1793A) (rs868014) analyzed by agarose gel electrophoresis on 3% agarose. DNA markers: 1000 bp molecular weight; PCR product: amplicon size 528 bp.
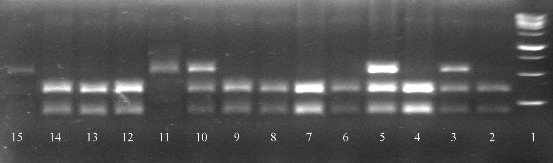
Fig. 5 Results of MTHFR gene polymorphism (single nucleotide polymorphism (SNP), A677G) (rs868014) product by agarose gel electrophoresis. PCR product of MTHFR gene was digested with BsrbI restriction enzyme. The product of digestion was electrophoresed on 3% agarose. Line (1) DNA ladder: 1000 bp molecular weight; Line (2), (4), (6)-(7)(8)(9), (12)-(14) TT genotype: 335 and 193 bp; Line (3), (5) and (10) CT genotype: 528, 335 and 193 bp; Line (11) and (15) AA genotype: 528 bp.
Statistical analysis
Statistical analysis was carried out using SPSS ver. 16 software. The odds ratio (OR) and 95% confidence interval (CI) were calculated for various genotypes. The Hardy-Weinberg equilibrium (HWE) for the healthy normal and healthy morbidly obese were tested, and the differences between two groups were assessed by Chi-square test.
Result and Discussion
General characteristic
In this study, we compared between morbidly obese and non-obese groups through clinical characteristics. The result showed higher levels of fasting blood glucose (FBG), total cholesterol (TC), triglyceride (TG), VLDL, LDL-C, insulin, insulin resistant, systolic blood pressure (SBP) and diastolic blood pressure (DBP) in morbidly obese cases than in non-obese cases. On the other hand, no significant differences between two groups in the value of HDL-C was observed, as shown in Table 1.
Table 1 Clinical characteristics of the study subjects (n = 150)
|
Variable |
Morbidly obese |
Non-obese |
P-value |
|
Age (year) |
34.06 ± 9.54 |
33.27 ± 9.49 |
-- |
|
BMI (kg/m2) |
42.33 ± 0.66 |
22.42 ± 0.27 |
0.0001 |
|
FBG (mmol/L) |
103.93 ± 3.52 |
92.22 ± 1.68 |
0.0029 |
|
TC (mmol/L) |
197.92 ± 5.84 |
169.85 ± 2.72 |
0.0001 |
|
TG (mmol/L) |
133.04 ± 4.66 |
97.22 ± 3.56 |
0.0001 |
|
HDL-C (mmol/L) |
39.91 ± 0.61 |
40.66 ± 0.59 |
0.377 |
|
LDL-C (mmol/L) |
128.05 ± 4.19 |
102.96 ± 2.11 |
0.0001 |
|
VLDL (mmol/L) |
24.74 ± 0.77 |
19.62 ± 0.83 |
0.0001 |
|
Insulin (µIU/ml) |
17.08 ± 1.53 |
5.44 ± 0.14 |
0.0001 |
|
HOMA-IR |
8.31 ± 1.19 |
1.767 ± 0.07 |
0.0001 |
|
SBP (mmHg) |
13.10 ± 0.15 |
11.95 ± 0.09 |
0.0001 |
|
DBP (mmHg) |
8.44 ± 0.08 |
8.03 ± 0.04 |
0.0001 |
Note: BMI = body mass index; FBG = fasting blood glucose; TC = total cholesterol; TG = triglyceride; HDL-C = high-density lipoprotein cholesterol; LDL-C = low-density lipoprotein cholesterol; SBP = systolic blood pressure; DBP = diastolic blood pressure.
Association of MTHFR polymorphisms with morbidly obese
The result showed that MTHFR genotypes distribution for C677T, A1298C and G1793A did not deviate from HWE in healthy morbidly obese and healthy normal weight (control), as shown in Table 2. In C677T the frequencies of homozygous CC and heterozygous CT in the control group were 27.03% and 66.22% respectively, while in the morbidly obese group the values were 71.05% and 27.63% respectively. Therefore, there was a high statistically significant difference between the morbidly obese and non-obese groups for the CT genotype in the co-dominant model, OR = 1.26, 95% CI = 0.91 ~ 1.60, p-value = 0.0003. But no statistically significant relation was shown in the recessive model. However, in A1298C, significant differences were shown in three types of genotypes: AA, AC and CC where frequencies of them in both two groups were as follows: morbidly obese 18.92%, 64.86% and 16.22 % respectively, non-obese 40.79%, 55.26% and 3.95% respectively, where OR = 1.39, 95% CI = 0.91 ~ 1.58, p-value = 0.0001 for AA genotype, and OR = 0.702, 95% CI = 0.88 ~ 1.61, p-value = 0.0377 and OR = 0.844, 95% CI = 0.91 ~ 1.59, p-value = 0.0273 for AC and CC genotypes respectively in co-dominant model. And finally, in the last MTHFR-G1793A, we saw there was no effect for obesity on the result obtained for the two groups where no significant difference was shown between them, and the frequencies of GG, GA and AA were OR = 0.156, 95%, CI = 0.89 ~ 1.62, p-value = 0.285; OR = 0.163, 95% CI = 0.90 ~ 1.60, p-value = 0.271; and OR = 0.004, 95% CI = 0.87 ~ 1.60, p-value = 0.835, respectively (Table 2). Our study showed specific result when we correlated between each single nucleotide polymorphism (SNP) and insulin in morbidly obese people where statistically significant relationship was seen in Table 3. It was considered an important evidence that the substitution of rare to normal alleles in each C677T and A1298C SNP played an important role in levels of insulin and insulin resistance except MTHFR-G1793A polymorphism which showed non-significant relation with the parameters.
Table 2 Association of morbidly obesity with MTHFR C677T, A1298C and G1793A
|
Characteristics |
Morbidly obese (%) |
Non-obese (%) |
OR (95% CI) |
P-value |
Chi-square |
|
MTHFR-C677T |
|||||
|
Codominant model CC CT TT |
20 (27.03) 49 (66.22) 5 (6.75) |
54 (71.05) 21 (27.63) 1 (1.32) |
1.57 (0.88-1.62) 1.26 (0.91-1.60) 0.258 (0.88-1.60) |
0.0001 0.0003 0.082 |
12.74 10.06 1.52 |
|
Dominant model CC CT + TT |
20 (27.03) 54 (72.97) |
54 (71.05) 22 (28.95) |
1.57 (0.88-1.62) 1.42 (0.88-1.63) |
0.0001 0.0001 |
12.74 11.76 |
|
Recessive model CC + CT TT |
69 (93.24) 5 (6.75) |
75 (98.68) 1 (1.32) |
0.249 (0.91-1.62) 0.258 (0.88-1.60) |
0.094 0.082 |
1.84 1.52 |
|
MTHFR-A1298C |
|||||
|
Codominant model AA AC CC |
14 (18.92) 48 (64.86) 12 (16.22) |
31 (40.79) 42 (55.26) 3 (3.95) |
1.39 (0.91-1.58) 0.702 (0.88-1.61) 0.844 (0.91-1.59) |
0.0001 0.0377 0.0273 |
10.42 4.98 5.26 |
|
Dominant model AA AC + CC |
14 (18.92) 60 (81.08) |
31 (40.79) 45 (59.21) |
1.39 (0.91-1.58) 1.08 (0.88-1.57) |
0.0001 0.0071 |
10.42 7.94 |
|
Recessive model AA+AC CC |
62 (83.78) 12 (16.22) |
73 (96.05) 3 (3.95) |
0.79 (0.92-1.63) 0.844 (0.91-1.59) |
0.037 0.0273 |
5.02 5.26 |
|
MTHFR-G1793A |
|||||
|
Codominant model GG GA AA |
1 (1.35) 8 (10.81) 65 (87.87) |
1 (1.32) 6 (7.89) 69 (90.79) |
0.156(0.89-1.62) 0.163(0.90-1.60) 0.004(0.87-1.60) |
0.285 0.271 0.835 |
0.006 0.319 0.315 |
|
Dominant model GG GA+AA |
65 (87.84) 9 (12.16) |
69 (90.79) 7 (9.21) |
0.156(0.89-1.62) 0.179(0.86-1.64) |
0.285 0.437 |
0.315 0.175 |
|
Recessive model GG+GA AA |
73 (98.65) 1 (1.35) |
75 (98.68) 1 (1.32) |
0.003(0.93-1.56) 0.004(0.87-1.60) |
0.833 0.835 |
0.004 0.006 |
|
BMI |
38 < BMI > 62 |
17 < BMI > 24.9 |
|
|
|
Note: BMI = body mass index; MTHFR = methylenetetrahydrofolate reductase; OR = odds ratio; CI = confidence interval.
Table 3 Correlation between parameters and multiple genotypes in the three types of MTHFR-SNP
|
Parameters |
Morbidly obese (%) |
FBS |
Insulin |
HOMA-IR |
|
C677T CC CT TT LSD |
20(27.03) 49(66.22) 5(6.75) |
86.20 ± 1.19 103.16 ± 1.80 152.40 ± 33.02 17.36 ** |
9.04 ± 0.31 16.86 ± 1.51 51.40 ± 2.73 7.42 ** |
7.20 ± 1.095 7.72 ± 1.41 10.06 ± 2.69 8.85 NS |
|
A1298C AA AC CC LSD |
14(18.92) 48(64.86) 12(16.22)
|
84.00 ± 1.37 101.50 ± 1.89 136.92 ± 17.34 13.99 ** |
9.78 ± 0.41 15.29 ± 1.52 32.76 ± 5.18 5.98 ** |
7.05 ± 1.62 7.75 ± 1.41 11.30 ± 3.79 7.13 NS |
|
G1793A GG GA AA LSD |
1(1.35) 8(10.81) 65(87.87) |
77.00 ± 0.00 82.12 ± 0.74 107.03 ± 3.85 35.65 NS |
8.00 ± 0.00 10.17 ± 0.55 14.07 ± 1.70 15.24 NS |
3.20 ± 0.00 6.19 ± 1.29 7.91 ± 3.42 18.19 NS |
Note: FBS = fasting blood sugar; NS = non-significant; LSD = p-value; * p-value < 0.05); ** p-value < 0.01.
Finally, the results obtained for the effect of MTHFR (C677T), (A1298C) and (G17793A) polymorphisms on the risk of T2D in morbidly obese people is not a crucial limitation because anyone is born with specific genotypes different from each other, yet we just analyzed three polymorphisms without considering any environmental factors such as smoking, sport, lifestyle and alcohol consumption, so the role of other genes and factors cannot be excluded.
Conclusions
In conclusion, results showed that two types of SNP of MTHFR (C677T and A1298C) polymorphisms were associated significantly with morbid obesity, and therefore elevated the risk of T2D in Iraqi population, Furthermore, we found there was no significant relationship between obesity and the substitution of A to G in MTHFR-G1793A polymorphism. Finally, many studies and evidence support that genetic factors by themselves may not directly affect the risk of disease, but presence of defect in genes when associated with environmental exposures and life styles may increase the risk of disease.
Conflict of Interests
The authors declare that no competing interest exists.
Reference
Copyright© Fatimah Sahib Abed, Hanaa Addai Ali, Omid Ranaei Siadat, Fataneh Fatemi, and Sareh Arjmand. This is an open-access article distributed under the terms of the Creative Commons Attribution License, which permits unrestricted use, distribution, and reproduction in any medium, provided the original author and source are credited.

|
Nano Biomedicine and Engineering. Copyright © Shanghai Jiao Tong University Press |
 |