Research Article
Antimicrobial Activity of Chemical, Thermal and Green Route-Derived Zinc Oxide Nanoparticles: A Comparative Analysis
Mideksa Kasahun 1, Alemayhu Yadate 1, Abebe Belay 1*, Zerihun Belay 2, Murugan Ramalingam 3
1 Adama Science and Technology University, Department of Applied Physics, P.O. Box, 1888, Adama, Ethiopia.
2 Adama Science and Technology University, Department of Applied Biology, P.O. Box, 1888, Adama, Ethiopia.
3 Organ Engineering Lab, Centre for Biomaterials, Cellular and Molecular Theranostics, School of Mechanical Engineering, Vellore Institute of Technology (Deemed to be University), Vellore 632014, India.
* Corresponding authors. E-mail: abebebelay96@gmail.com
Received: Dec. 4, 2019; Accepted: Feb. 7, 2020; Published: Feb. 17, 2020
Citation: Mideksa Kasahun, Alemayhu Yadate, Abebe Belay, Zerihun Belay, and Murugan Ramalingam, Antimicrobial Activity of Chemical, Thermal and Green Route-Derived Zinc Oxide Nanoparticles: A Comparative Analysis. Nano Biomed. Eng., 2020, 12(1): 47-56.
DOI: 10.5101/nbe.v12i1.p47-56.
Abstract
In this study, antimicrobial activity of zinc oxide (ZnO) nanoparticles (NPs) synthesized by different chemical, thermal and green routes were systematically investigated with an aim to determine which method yields the most efficient antimicrobial property. The methodologies employed in this study were sol-gel, thermal decomposition, precipitation and green synthesis routes. The physical and optical properties of synthesized ZnO NPs were characterized by X-ray diffraction (XRD), scanning electron microscope (SEM), ultraviolet–visible spectroscopy (UV-Vis) and fluorescence spectroscopy. The results of the XRD and SEM analysis indicated the size and shape of the particles, depending on synthesis methodology and calcination temperature. The optical properties of the ZnO NPs investigated using UV-Vis absorption and photoluminescence spectra were also depending on the synthesized route. The antimicrobial activity of the ZnO NPs was tested against gram-negative bacteria (E. coli, P. aeruginosa and S. typhi), gram-positive bacteria (S. aureus and B. subtilis) and fungus (C. albicans) using agar-well diffusion method. Effects of size, shape of the crystal and concentration on the antimicrobial activity were investigated. The experimental results showed that the antimicrobial activity of ZnO NPs increased with decreasing size of the crystal. It was also found that the gram-positive bacteria were more sensitive to ZnO NPs than gram-negative bacteria and fungus. Interestingly, ZnO NPs synthesized using the green route showed more effective antimicrobial activity than those using the chemical or the thermal route.
Keywords: Zinc oxide nanoparticles; Sol-gel; Thermal decomposition; Precipitation; Green synthesis, Antimicrobials
Introduction
Nanoparticles (NPs) are special class of materials that have the particles in the size range 1 to 100 nm in at least one dimension. Due to their nanoscale feature, NPs have unique and reasonably better functional properties than their micro- or macro-scale counterparts. Among the various metallic oxide nanoparticles, zinc oxide (ZnO) NPs is considered as one of the most important materials due to their utilization in various fields including biomedical. ZnO NPs have unique physical, chemical and biological properties. For instance, ZnO NPs have high chemical stability, high electrochemical coupling coefficient, broad range of absorption radiation and high photostability with multifunctional material [1, 2]. It has direct wide band gap energy (3.37 eV), large exciton-binding energy (60 meV) and high thermal and mechanical stability at room temperature [3-6]. ZnO NPs also have several advantages due to low toxicity, biocompatibility and biodegradability, which make the material important for anti-bacterial, anti-fungal, and wound healing applications [7-10]. The materials have also particular interest because they can be prepared easily and inexpensively. Several studies have been conducted on various factors affecting the shape, size, and optical properties of ZnO NPs. The factors are precursor concentrations [11], temperature [12-13], surfactant concentrations [14-15], dopant concentrations [10], solvent medium [16] and pH of the reaction mixture [17]. The antimicrobial activity of zinc oxide nanoparticles has also been studied against gram-negative and gram-positive bacteria using chemically synthesizing method [18-22]. The advantageous of using ZnO nanoparticle as antimicrobial agents are their greater effectiveness on resistant strain of microbial pathogens, less toxicity and heat resistance. In addition, they provide essential mineral to human cells and even small amount of them exhibit strong activity. The main mechanism of antimicrobial activities of ZnO NPs is the electrostatic interaction between ZnO NPs and cell membrane of the bacteria, internalizations of ZnO NPs into the cell of bacteria, and the formation of reactive oxygen species (ROS) inside the cell of bacteria, which destroys the cytoplasm of the bacteria. The earlier studies indicated gram-positive bacteria have higher susceptibility to ZnO NPs than gram-negative bacteria due to that they have simpler cell membrane structure and the difference in intracellular antioxidant content [23]. To the best of our knowledge, however, the comparison study of antimicrobial activities of ZnO NPs synthesized using different methods has not yet been reported. Therefore, in the present study, ZnO NPs were synthesized using sol-gel, thermal decomposition, precipitation and green methods and applied on gram-negative bacteria (E. coli, P. aeruginosa and S. typhi), gram-positive bacteria (S. aureus and B. subtilis) and fungus (C. albicans) to determine which method yields the most efficient antimicrobial property. The minimum inhibitory concentration (MIC) and zone of inhibition (ZOI) of ZnO NPs were investigated on gram-negative bacteria, gram-positive bacteria and fungus. The size, shape and optical properties of synthesized ZnO NPs were characterized using X-ray diffraction (XRD), scanning electron microscope (SEM), Ultraviolet-visible spectroscopy (UV-Vis) and fluorescence spectroscopy.
Experimental
Materials
Materials and chemicals used for synthesis of ZnO NPs were zinc nitrate hexahydrate (HiMedia, India), polyvinyl Alcohol (HiMedia, India), sodium hydroxide (Alpha Chemika, India), zinc acetate dihydrate (UniChem, India), and leaf of a plant species (Moringa oleifera) collected from Adama, Ethiopia. The plant contains several phytochemical compounds in its natural extract. Culture media such as Müller-Hinton agar (MHA) (M173-500G HiMedia India), tryptone soya agar (TSA) (T131-500G HiMedia, India), and nutrient broth (N173-500 G HiMedia India) for cultivation of the test organisms. Dimethyl sulfoxide (DMSO) (99% Unichem, India) and double distilled water were used as the solvent. All chemicals were of analytical grade and used as received condition.
Synthesis methods
Different synthesis methods were applied to get different morphology and optical properties of ZnO NPs. The sol-gel method of synthesizing ZnO NPs was as follows. 6 g of polyvinyl alcohol (PVA) and [-CH2CHOH-]n were dissolved in 60 mL of double distilled water and stirred by magnetic stirrer for 30 min. Again 2 g of zinc nitrate hexahydrate (Zn(NO3)2·6H2O) was separately dissolved in 20 mL of double distilled water and stirred for 15 min. The solution of zinc nitrate hexahydrate solution was added into PVA solution drop by drop at 70 ℃ under suitable magnetic stirring for 2 h. The mixture solution was stirred until the gel-like substances formed; this gel type sample was allowed to dry in an oven at 160 ℃ for 12 h. The sample was calcinated in furnace for 8 h at the temperature of 400 ℃ under similar procedure. The other samples were prepared at calcination temperature of 500 ℃.The thermal decomposition method of synthesizing ZnO NPs was performed according to the following procedure. 15 g of the zinc acetate dihydrate was calcinated in muffle furnace at the temperature of 400 ℃ for 3 h reaction times without any special atmospheric condition. The precipitation method of synthesis was carried out according to the following procedure. 12 g of zinc acetate dihydrate, (Zn (CH3COO)2 .2H2O), was dissolved in 100 mL of double distilled water in a beaker and stirred for 30 minutes at the temperature of 60 ℃. Similarly, 3 g of NaOH was dissolved in 40 mL of double distilled water in a separate beaker and stirred for 15 minutes. The solution of sodium hydroxide was added to zinc acetate dihydrate solution with constant stirring to form aqueous of milky white colloid solution. The reaction was allowed to proceed for 2 h after addition of sodium hydroxide. The solution was allowed to settle and dry in oven at 160 ℃ for 4 h. The sample was calcined at 200 ℃ for 2 h reaction times in furnace without any special atmospheric condition. By similar procedure, other samples were prepared at the temperatures of 300 and 500 ℃, respectively. The green method of synthesis of ZnO NPs from Moringa oleifera leaves was prepared according to the following procedure. 12 g of Moringa oleifera leaves were dissolved in 200 mL of double distilled water. The solution stirred for 20 min using magnetic stirrer at 60 ℃. The extracted Moringa oleifera leaf was used for synthesis of ZnO nanoparticles. 20 mL of leaf extracted solution added to 2 g of zinc nitrate hexa-hydrate (Zn (NO3)2. 6H2O). The mixed solution stirred for 30 min at 80 ℃ and cooled at room temperature. The color of the solution turns to yellow and calcinated at 400 ℃ for 2 h in furnace. Finally, white powder was obtained.
Characterizations
The X-ray diffraction (XRD) pattern of ZnO was analyzed using X-ray diffractometer by generating Cu-Kα radiation (λ = 1.54056Ả). It was used to determine the crystalline phase of the synthesized nanoparticles. An X-ray generator operated at a voltage of 40 kV and current of 30 mA was applied at room temperature. Intensities were measured at room temperature for angle range 2θ = 10° ≤ 2θ ≤ 80. All the diffraction peaks were well indexed to the hexagonal ZnO wurtzite structure (JCPDS card no. 36-1451). The average crystal size was calculated from the Debye Scherrer formula as follows [24],
![]() (1)
(1)
where λ, θ, β and D are x-ray wavelength, Bragg’s diffraction angle, full width at half maximum of the peak and average grain size of the crystalline particle respectively. The lattice parameters ‘a’ and ‘c’ and the spacing distance dhkl for the wurtzite structure of ZnO can be calculated using the Eq. (2) and (3):
![]() and
and ![]() , (2)
, (2)
 . (3)
. (3)
The unit cell volume (V) of the hexagonal system was calculated using the following formula [25],
![]() . (4)
. (4)
The morphology of the sample was investigated using a scanning electron microscope (Hitachi, H-7600). The optical absorption of the samples was measured by UV-Vis-NIR spectrophotometer (Perkin Elmer, Lambda 950) in the wavelength regions of 200-500 nm at 2 nm resolutions. The band gap energy (Eg) of ZnO NPs was also calculated using Eq. (5),
![]()
![]() , (5)
, (5)
where h is the Planck’s constant (6.626 × 10⁻³⁴ Js), c is the light velocity (3x10⁸ m/s) and λ is the peak wavelength (nm). The photoluminescence properties of ZnO NPs were measured by spectrofluorometer (Fluoromax-4, Spectrofluorometer) at room temperature using Xe lamp as the excitation light source. The excitation wavelength and emission spectra were set at 325 and 350-620 nm respectively.
In vitro antimicrobial activity of ZnO NPs was determined using agar well diffusion method [27] against 5 bacteria species (S. aureus, B. subtilis, P. aeruginosa, E. coli and S. Typhi) and yeast (C. albicans). The strains were transferred to nutrient broth and incubated to grow aerobically at 37 ℃ for 24 h until it achieved the turbidity of 0.5 McFarland standards. 0.01 mL of each sub-cultured bacteria and yeast test organisms were spread plated using sterilized cotton swab on 20 mL of sterilized molten and cooled MHA media and TSA media, respectively. Subsequently, agar wells of 5 mm diameter were prepared on different plates with sterilized stainless steel cork borer and labeled properly. About 100 µL of different concentrations (0.1 -106.24 mM) of ZnO were added into well using micropipette. The plates containing the microbes and ZnO nanoparticles were incubated at 37 ℃ for 24 h in case of bacteria and at 28 ℃ for 48 h in case of yeas. The plates were examined for evidences of zones of inhibition, which appear as a clear area around the wells. The diameter of such zones was measured using ruler and mean value for each organism recorded and expressed in millimeter. The microbial activity of ZnO NPs was checked by determining the minimum inhibitory concentration (MIC) using agar dilution method. The MIC was the lowest concentration of nanoparticles that did not permit any visible growth of microbes during 24 h of incubation. After inoculation of target bacteria and fungi on Mycobacterium avium subsp. hominissuis (MAH) and tryptic soy agar (TSA), respectively with different concentrations of NPs, the growth of test organisms was determined by counting colony forming unit (CFU) in each plate. The lowest concentration from which the bacteria and fungi did not grow when transferred to fresh medium was MIC. The standard antibiotic drug gentamicin and the sterile distilled water were used as positive and negative control respectively. All experiments were performed three times and the results were averaged.
Results and Discussion
X-ray diffraction (XRD) analysis
The XRD pattern of ZnO NPs synthesized by sol-gel, thermal decomposition, precipitation and green methods are shown in Fig. 1(a)-(e). All diffraction peaks are in a good agreement with wurtzite structure (hexagonal phase, space group P63mc) with lattice parameters a = b = 3.249 Å and c = 5.206 Å as reported in (JCPDS card no. 36-1451). The nine characteristic peaks were appeared at 2θ = 31.802°, 34.468°, 36.306°, 47.600°, 56.592°, 62.951°, 66.411°, 67.91°, 69.152°, corresponding to (100), (002), (101), (102), (110), (103), (200), (112) and (201) of crystal planes. The diffraction peak (101) was the most intense peak, indicating the preferred growth plane. The diffraction peak intensity also remarkably increased with the calcination temperature for synthesizing NPs under the same procedures. The calcination temperature led to an improvement in the crystallinity and was associated with the increase in crystal size, and diffraction intensity. On the other hand, the full width at half maximum (FWHM) of ZnO NPs decreased as the temperature increased [28-29]. The result also indicated increment in the crystal size of ZnO NPs as the calcination temperature increased was in good agreement with the result reported previously [30-33]. The average crystal size of ZnO NPs was calculated using Debye Scherrer formula, Eq. (1) based on FWHM of the peaks as shown in Table 1. The average crystal size of ZnO NPs synthesized using sol-gel, thermal decomposition precipitation methods was in the range of 22-42 nm. On the other hand, crystalline size synthesized using green method was 8 nm. The study result indicated the existence of size difference between green and chemical methods. The lattice parameters a, c, and the plane spacing distance dhkl were calculated using Eq. (1)-(3) and are tabulated in Table 1. The calculated results were consistent with standard of ZnO wurzite structure (hexagonal phase, space group P63mc) which had lattice parameters a = b = 3.249 Å and c = 5.206 Å as reported in JCPDS card No. 36-1451. The unit cell volume of ZnO NPs was estimated using Eq. (4) and is shown in Table 1. As can be observed in Table 1, there was a significant decrease in unit cell volume as the calcination temperature increased especially for NPs synthesized using the precipitation method. This may be due to the fact that there were large numbers of oxygen vacancies and vacancy clusters.
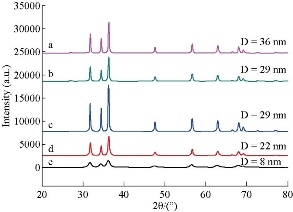
Fig. 1 X-ray diffraction patterns of ZnO NPs synthesized using (a) and (b) precipitation at calcination temperature 400 and 500 ℃, (c) thermal decomposition at 400 ℃ for 3 h, (d) sol-gel method at calcination temperature of 400 ℃, and (e) green synthesis method.
Table 1 Lattice parameters, interplanar spacing, crystal size and unit cell volume of ZnO NPs synthesized using sol-gel, thermal decomposition and precipitation methods at different calcination temperatures
|
Synthesized ZnO NPs |
Lattice parameters |
V (Å3) |
d(101)(nm) |
Crystal size (nm) |
||
|
a (nm) |
c (nm) |
c/a |
||||
|
Sol-gel at 400 ℃ |
0.3246 |
0.52072 |
1.6041897 |
47.513 |
0.247749074 |
22.04 ± 2 |
|
Sol-gel at 500 ℃ |
0.3252 |
0.520963 |
1.6019772 |
47.711 |
0.24774905 |
29.38 ± 2 |
|
Thermal decomposition 400 ℃ |
0.3252 |
0.520981 |
1.6020325 |
47.713 |
0.247746451 |
29.30 ± 4 |
|
Precipitation at 200 ℃ |
0.32501 |
0.520812 |
1.6024491 |
47.642 |
0.247628754 |
29.92 ± 1 |
|
Precipitation at 300 ℃ |
0.3249719 |
0.520561 |
1.6023577 |
47.578 |
0.247507575 |
36.90 ± 3 |
|
Precipitation at 400 ℃ |
0.3252688 |
0.495621 |
1.5237274 |
45.410 |
0.244908146 |
41.67 ± 2 |
|
Green method (M1) |
0.34433 |
0.52112 |
1.5314 |
53.506 |
0.258822 |
8.88 ± 0.63 |
Scanning electron microscope (SEM) and dynamic light scattering (DLS) analyses
The SEM images of ZnO NPs synthesized by sol-gel, thermal decomposition, precipitation and green methods are shown in Fig. 2(a)-(d). The morphology of ZnO NPs synthesized using precipitation and sol-gel methods were spherical in shape and their sizes were also in agreement with XRD results. On the other hand, rod shape was observed for NPs synthesized using the thermal decomposition method. Similarly, NPs synthesized using the green method indicated the aggregation of thinner nanosheets to form nanosheet networks, where individual sheet had large lateral dimension. The present results of SEM are in a good agreement with previous report that documented green synthesized ZnO nanosheets and nanoflowers [34]. The size distribution profile of chemically synthesized ZnO NPs, which was achieved via DLS measurements, is shown in Fig 3(a) and (b). A maximum intensity at the average particle size of 223 and 345 nm for thermally decompose and precipitation methods were obtained. Particle size distribution of NPs can be influenced in several ways: Sonification, adding stabilizers, and dispersant. The increase in the size of NPs in both methods is due to low viscosity of water, resulting in high agglomeration as compared to other solvents like ethylene glycol.
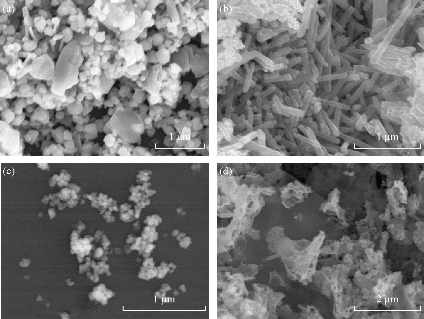
Fig. 2 Scanning electron microscope image of ZnO NPs synthesized using (a) precipitation at calcination temperature 400 ℃, (b) thermal decomposition at 400 ℃ for 3 h, (c) sol-gel method at calcination temperature of 400 ℃, and (d) green synthesis method.
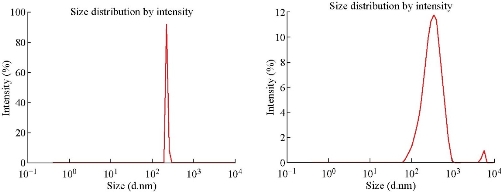
Fig. 3 Dynamic light scattering size distribution of ZnO NPs synthesized using (a) thermal decomposition method and (b) precipitation method.
Ultraviolet-visible absorption analysis
The ultraviolet-visible absorption spectra of ZnO NPs synthesized by sol-gel, thermal decomposition, precipitation and green methods are shown Fig. 4(a)-(e). The absorption peaks of the samples were observed in the wavelength region of 344-377 nm. The corresponding optical band gap energy calculated using Eq. (5) was found to be in the range of 3.29-3.60 eV. ZnO NPs synthesized using the green method had higher band width (3.6 eV) as compared to the chemically synthesized NPs. The absorption peaks are related to the electronic transition from valance band to conduction band. All ZnO NPs samples exhibited blue shifted absorbance peak as compared to their bulk counterpart having absorbance peak at 386 nm (3.2 eV) at room temperature [35-36]. Also, blue shifts in the peak of absorbance were observed as the size of the particle decreased, due to the increase in quantum confinement of the particle.
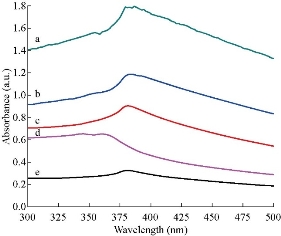
Fig. 4 Ultraviolet-visible absorption spectra of ZnO NPs synthesized using (a) and (b) precipitation method at 200 ℃ (λmax = 376 nm) and 300 ℃ (λmax = 377 nm) calcination temperature, (c) thermal decomposition method at 400 ℃ for 3 h (λmax = 375 nm), (d) green method (λmax = 344 nm), and (e) sol-gel method at 400 ℃ calcination temperature (λmax = 374 nm).
Emission spectra analysis
Fig. 5(a)-(e) shows the emission spectra of ZnO NPs synthesized by different methods. The emission spectra exhibited two bands: One was in the UV region of 390-400 nm, and the other was in the visible region of 420-650 nm. The samples exhibited sharp UV emission peaks at 398, 400 and 390 nm, which was attributed to the recombination of electrons in the conduction band and holes in the valance band [37]. The UV emission intensity of ZnO NPs synthesized using chemical methods increased with the decrease of size of the particles as shown in Fig. 5(b)-(e). The results were evaluated in terms of intrinsic particle absorption and the number concentration of particles. It was shown that the particles became opaque for particle size greater than 70 nm. For larger sizes the absorbance decreased with increasing size due to the decrease in particle concentration. The visible emission spectra of the samples consisting different peaks in the violet and blue regions (420, 464, 666, 474, 484) were basically due to transition of electron from conduction band (CB) to valence band (VB) and shallow level to deep level [38]. The photoluminescence spectra reveal that for all samples the green luminescence band observed in the wavelength region of 507-522 nm related to recombination of the electron in singly ionized oxygen vacancies with the photon excited holes in the valance band. The yellow band appeared in our samples at 560 and 550 nm for thermal and precipitation methods due to the recombination of electron with deeply trapped holes in the oxygen interstitials (Oi) located at around 2.2 eV below conduction band. The orange luminescence band around 610 nm for all samples can be attributed to the transition of electron from conduction band to oxygen interstitials located at 1.34 eV above the balance band [39].
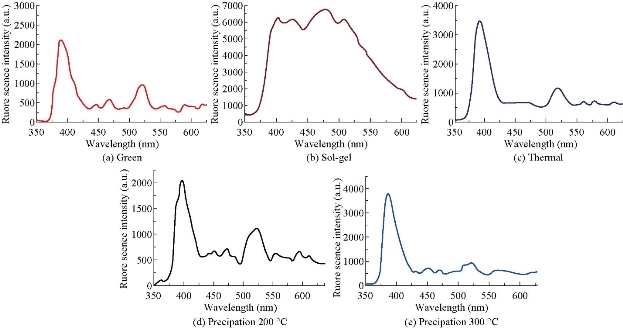
Fig. 5 The emission spectra of ZnO NPs synthesized using (a) green method, (b) sol-gel method at 400 ℃ calcination temperature, (c) thermal decomposition method at 400 ℃ for 3 h, (d) and (e) precipitation method at 200 and 300 ℃, respectively.
Antimicrobial activity of the ZnO nanoparticles
The antimicrobial activities of sol-gel, thermal decomposition, precipitation and green route-derived ZnO NPs suspensions of different concentrations towards various bacterial and fungal pathogens were tested by the well diffusion agar methods (Fig. 6). ZnO NPs synthesis using all the above methods showed antimicrobial activity against all selected test organisms, but maximum activity was observed in S. aureus and minimum activity was in C. albicans (Fig. 7). Previously, it was reported that gram-negative bacteria and fungus seemed to be more resistant to ZnO NPs than gram-positive bacteria [19, 20]. The mechanisms of ZnO NPs for antimicrobials are due to the disruption of cell membranes of bacteria and fungus probably by the production of reactive oxygen species (ROS), such as superoxide anion, hydroxyl radicals and hydroxyl ion [40, 41]. In our study, the antimicrobial activity of ZnO NPs increased with decreasing size of the crystal. It showed that smaller size particles enhanced antimicrobial activity due to the larger surface area to volume ratio. The antimicrobial activities of ZnO NPs synthesized using green method showed significantly larger zone of inhibition when compared to other chemical methods due to the difference in size of NPs (Fig. 8). The results also indicated the chemically synthesized NPs with rod shape performed better antimicrobial activities than the others. Similarly, it was reported that green ZnO NPs were responsible for significantly higher antimicrobial activity [42]. They suggested that green ZnO NPs could be applied effectively in agriculture and food industry. The minimum concentration of ZnO NPs which completely inhibited the growth of bacteria and fungus were found to be in the range of 21-43, 37-70 and 86-119 μg/mL for gram-positive bacteria, gram-negative bacteria and fungus, respectively (Table 2). Minimum concentration of ZnO NPs (21 µg/mL) was recorded in S. aureus by thermal decomposition method where maximum concentration was recorded in C. albicans by precipitation method (Table 2). Our results also confirmed that gram-negative bacteria and fungus were inhibited at higher concentrations of ZnO NPs than gram-positive bacteria.
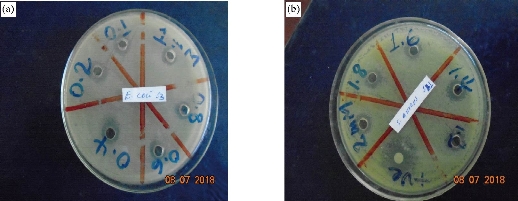
Fig. 6 The antibacterial activity of ZnO NPs synthesized using thermal decomposition method and applied on (a) E. coli and (b) S. aureus.
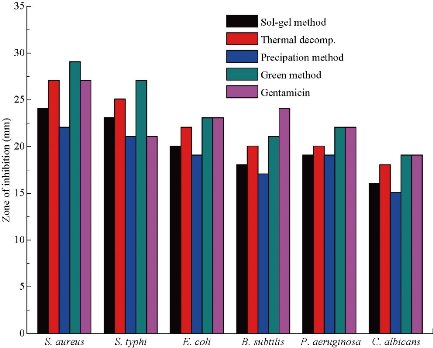
Fig. 7 The antimicrobial activities of ZnO NPs synthesis using sol-gel, thermal decomposition, precipitation, green methods and gentamicin drug at the concentration of 1280 μg/mL.
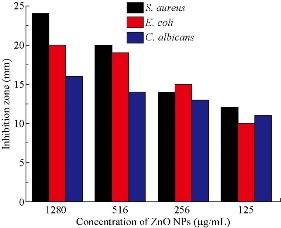
Fig. 8 Antimicrobial activities of different concentrations of ZnO NPs synthesized using sol-gel method against gram-positive bacteria (S. aureus), gram-negative bacteria (E. coli) and fungus ( C. albicans).
Table 2 Minimum inhibitory concentration (MIC) values in µg/mL of ZnO NPs synthesized using different techniques
|
Type of pathogens |
MIC (µg/mL) of ZnO NPs synthesized using different methods per zone of inhibition (mm) |
||
|
Sol-gel at 400 ℃ |
Thernal decomposition |
Precipitation at 200 ℃ |
|
|
E. coli |
43.4 ± 15 |
37.97 ± 24 |
54.25 ± 18 |
|
P. auruginosa |
48.82 ± 16 |
43.4 ± 18 |
59.67 ± 24 |
|
B. subtillis |
32.55 ± 16 |
37.97 ± 24 |
43.40 ± 9 |
|
S. aurues |
29.83 ± 20 |
21.70 ± 9 |
43.40 |
|
S. typhi |
54.25 ± 9 |
48.82 ± 16 |
70.52 ± 12 |
|
C. albicans |
92.23 ± 9 |
86.80 ± 13 |
119.35 ± 33 |
Conclusions
ZnO NPs were synthesized by different methods, ranging from chemical, thermal to green route, and the efficacy of their antimicrobial activities was investigated and compared. The synthesized NPs were characterized using XRD, SEM, DLS, UV-Vis and fluorescence spectroscopy. The results of this study revealed that the antimicrobial activity of ZnO NPs increased with decreasing size of the crystal. Also, the results indicated that the gram-positive bacteria were more sensitive to ZnO NPs than gram-negative bacteria and fungus. Overall, it was found that the antimicrobial activity of ZnO NPs synthesized using green method was more effective than that of ZnO NPs synthesized by chemical methods due to difference in the size of NPs.
Acknowledgments
The authors would like to acknowledge Adama Science and Technology University and Ministry of Innovation and Technology of Ethiopia for financial support, Pusan National University, Department of Nanoscience and Nanotechnology, South Korea for allowing us to use DLS, fluorescence spectroscopy and SEM for characterizations of the samples.
Conflict of Interests
The authors declare that no competing interest exists.
References
Copyright© Mideksa Kasahun, Alemayhu Yadate, Abebe Belay, Zerihun Belay, and Murugan Ramalingam, This is an open-access article distributed under the terms of the Creative Commons Attribution License, which permits unrestricted use, distribution, and reproduction in any medium, provided the original author and source are credited.

|
Nano Biomedicine and Engineering. Copyright © Shanghai Jiao Tong University Press |
 |