Research Article
Fast Colorimetric Method for the Detection of Captagon Based on a General Sensor Design Involving Aptamers and Gold Nanoparticles
Abbas Alfadly 1*, Ali Abdulwahid 1, Afrodet Saleh 2
1 Department of Chemistry, College of Science, University of Basrah, Basrah, Iraq.
2 Department of Pathological Analyses, College of Science, University of Basrah, Basrah, Iraq.
* Corresponding author. E-mail: derbas.iq@gmail.com Tel.: +9677703457710
Received: Mar. 5, 2020; Accepted: Apr. 14, 2020; Published: Apr. 14, 2020
Citation: Abbas Alfadly, Ali Abdulwahid, and Afrodet Saleh, Fast Colorimetric Method for the Detection of Captagon Based on a General Sensor Design Involving Aptamers and Gold Nanoparticles. Nano Biomed. Eng., 2020, 12(2): 124-131.
DOI: 10.5101/nbe.v12i2.p124-131.
Abstract
Illicit drug use represents a worldwide health problem involving about 5% of world’s adult population and contributing to crime misery and insecurity. A widely used illicit drug in Iraq in recent years is Captagon, which is second only to methamphetamine. It is also popular in Middle East especially in Syria, Saudi Arabia and Kuwait. It is the brand name of chemical compound Fenethylline, and it is a derivative substantial of amphetamines. It is amphetamine coupled with theophylline via an alkyl chain. We used a rapid, low-cost colorimetric assay for sensitive and visual detection of Captagon in real human samples using a Captagon-specific aptamer as the recognition element and original gold nanoparticles as indicators. The method indicated that the presence of Captagon resulted in gold nanoparticles (Au NPs) solution’s color change from purple to blue. The method was rapid and also worked well in human urine samples, blood and hair. Colorimtric detection of Captagon could be measured either visually or by measurement of the absorbance intensity ratios at 650 and 520 nm, respectively. It worked in the 2 μM to 50 μM concentration range. Selectivity of captgon detection method was also investigated with illicit and licit drugs, which revealed that an obvious change both in absorption spectra and in visual color was observed upon the addition of Captagon, whereas slight and negligible change occurred in the presence of any examined drugs with the similar concentration as Captagon. Our findings presented that hair was a good example for detection of drug history of Captagon and other illicit drugs compared with urine and blood, which is believed to represent a widely applicable aptamer-based detection system.
Introduction
Illicit drugs are those for which nonmedical use is forbidden by the national or international laws. It represents a worldwide health problem involving about 5% of world’s adult population and contributing to crime misery and insecurity [1, 2]. A widely used illicit drug in Iraq in recent years is Captagon. It is the brand name of chemical compound Fenethylline as active ingredients, and it is a derivative substantial of amphetamines. This chemical stimulant substance improves the mood and reduces the need to sleep as well as reduces appetite, with the regular use of Captagon for the aim of sex. It is amphetamine coupled with theophylline via an alkyl chain [3, 4]. It is second only to methamphetamine, and is also widely spread in Middle East especially Syria, Saudi Arabia and Kuwait [5, 6]. In Iraq, Captagon abuse by persons including drug addicts and recreational users also shows an increasing tendency; therefore, there is an immediate need of suitable methods for rapid detection of Captagon in biological samples. Many methods have been developed for the quantitative analysis of Captagon in the hair, plasma and urine, including gas chromatography-mass spectrometry (GC-MS), high performance liquid chromatography (HPLC), liquid chromatography-mass spectrometry (LC-MS), ion mobility spectrometry (IMS), capillary electrophoresis (CE), immunoassays, etc. Nevertheless, these methods still suffer from expensive apparatuses, tedious procedures, pollution to the environment, or absence of effective selectivity, while satisfactory sensitivity has been confirmed [7]. Thus, new probes and sensors for quick detection of Captagon with high sensitivity and selectivity are extremely preferred. Colorimetric sensors which signal the targeted happening via a visual color change in reaction media have been confirmed to be the most suitable methods. Due to their high extinction coefficiency and distance-dependent optical properties, gold nanoparticles (Au NPs) are developing as a significant kind of colorimetric indicator. In recent years, biological tool functional nucleic acids including oligonucleotide ligands, aptamers and riboswitches have been extensively used as target recognition elements in analytical-related applications [8]. Among the functional nucleic acids, aptamers have involved strong interest because of their competitive benefits over other biological tools. They are oligonucleotides, such as ribonucleic acid (RNA) and single-strand deoxyribonucleic acid (ssDNA) or peptide molecules that can fold into specific 3D structures and can bind to their targets with high affinity and specificity, due to their specific three-dimensional structures. Especially, RNA and ssDNA aptamers can differ from each other in sequence and folding pattern, although they bind to the same target. Aptamers can bind to a wide range of target molecules that include proteins, peptides, nucleotides, amino acids, antibiotics, low-molecular organic or inorganic compounds, microorganisms, tissues, and even whole cells with high affinity and specificity, in various applications including but not limited to therapeutics, drug delivery, molecular imaging, clinical diagnostics, biomarker discovery, food safety, and environmental monitoring [9-16]. Consequently, in this report, a colorimetric plan which used Au NPs as indicators and the aptamer as recognition moiety, was advanced for the quick detection of human sample captagon. Combination of the specification of aptamers and the spectroscopic benefits of Au NPs allowed the greatly selective and sensitive detection of Captagon. The assay exhibited rapid reactions towards Captagon in both aqueous solution and complex biological environments such as human urine, blood and hair, proving its possibilities as a significant tool for selective and sensitive Captagon detection in-field.
Experimental
Apparatus and reagents
Shape and size distribution of the synthesized Au NPs were checked by field emission scanning electron microscope (FESEM) FEI Nova NanoSEM 450 at Tehran University. Ultraviolet–visible spectroscopy (UV-Vis) spectrum was recorded by a Beckman DU730 UV-Vis spectrometer. Captagon, methamphetamine, tramadol, artane, valium, and dexamethasone were obtained from Basrah Forensic Office. The 40-mer aptamer (5’-ACG GTT GCA AGT GGG ACT CTG GTA GGC TGG GTT AAT TTG G-3’) was synthesized by Trilink biotechnologies (San Diego, USA). All other reagents were of analytical grade and were prepared from the departmental chemistry store, College of Science, University of Basrah.
Tetrachloroauric acid synthesis
This simple method to produce gold(III) chloride and it has many advantages over previous methods. A laboratory-scale reaction apparatus was gathered. Briefly, 14 mL of hydrochloric acid was located in a pressure-equalizing dropping funnel, and gradually added drop-wise to a side-arm flask containing 3.0 g of potassium permanganate. The resulting chlorine gas was passed into a two-neck round-bottom flask containing 100 mL deionized water and 1 pellet of gold (382 mg). Undissolved / unreacted chlorine gas was bubbled through a solution of 1.1 g sodium thiosulfate in 50 mL of water. The reaction mixture was stirred at the selected temperature (60 °C) until all of the gold dissolved at 40 h [17].
Au NPs synthesis
Au NPs were synthesized according to the citrate-mediated reduction. All glassware used in this procedure was cleaned in a bath of freshly prepared aqua regia, then rinsed thoroughly in distilled water and dried in air. A trisodium citrate solution (38.8 M, 2 mL) was rapidly added to a boiled solution of HAuCl4 (20 mL, 1 M) to temperature of 90 °C under vigorous stirring. A trisodium citrate served the dual purpose of being the reducing agent as well as stabilizer. After adding trisodium citrate the yellow color solution turned to colorless, and after 2 min it turned black and then to purple. The mixed solution was boiled for 10 min and further stirred for 15 min. The resulting purple solution was cooled to room temperature [18-20].
Colorimetric sensing of Captagon
20 μL aptamer (5 μM) was added into a 1.5 mL Eppendorf tubes. Then, 240 μL of captagon with different concentrations (0.2, 0.5,1.0, 2.0, 4.0, 6.0, 8.0, 10.0, 15.0, 20.0, 30.0, 40.0 and 50.0 μM) was added respectively. After incubation for 5 min, 300 μL of the Au NPs solution (5 nM) was added. The mixture was allowed to react for 5 min, and then 40 μL of NaCl (500 mM) solution was transferred quickly into the Eppendorf tubes. After incubation for 5 min, the resulting solution was transferred to a 1 cm path length quartz cuvette for spectral recording using a Beckman DU730 UV-Vis spectrometer and for photograph-taking using a digital camera (Fig. 1). All assays were performed at room temperature.
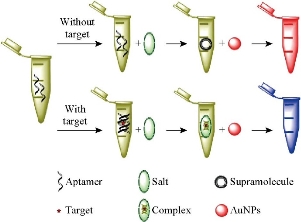
Fig. 1 Colorimetric detection of Captagon using aptamer as the recognition element and Au NPs as indicators.
Results and Discussion
Characterization of tetrachloroauric acid
The oxidation of gold metal to form aqueous solutions of gold(III) chloride was reliably and reproducibly achieved through introduction of chlorine gas to water containing the gold metal. Thus, the concentration of the gold(III) chloride solutions could be reasonably accurately calculated from the mass of the gold metal and the final volume of water. The UV-Vis spectrum of the resultant gold(III) chloride solution is shown in Fig. 1 and displays the expected peaks for a solution at pH 1.05. The absorption bands at 314 and 226 nm are assigned to ligand-to-metal charge transfer [17] as shown in Fig. 2. Melting point of the product as mentioned in literature is 254 ℃. The product was measured, and the result was 249 ℃. The difference in temperature indicated the presence of little impurities.
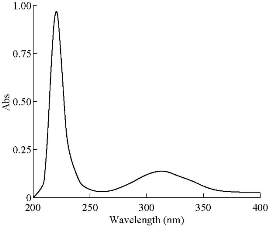
Fig. 2 UV-Vis spectrum of HAuCl4 in 0.1 M HCl.
Characterization of the nano sensing system
Au NPs were synthesized according to the citrate-mediated reduction [21, 22]. Average diameter of Au NPs was assessed to be about 13 nm from FESEM observation (Fig. 3). To demonstrate the possibility of the present assay, UV-Vis absorption spectra of Au NPs (Fig. 4) and Au NPs solution under diverse experimental conditions (Fig. 5) were measured. As shown in Fig. 6(a), original Au NPs showed a characteristic SPR peak at 520 nm and a purple color. After the adding of 200 mM NaCl into well dispersed Au NPs solution, the SPR absorption band of Au NPs broadened and a new absorption peak appeared at ~650 nm (Fig. 6(b)). Color variation from purple to blue of Au NPs was also noted with bare eyes. These results confirmed the phenomenon of salt-induced Au NPs aggregation. As a result of the coordination between Au and nitrogen atoms of single-strand DNA (ssDNA), aptamer could simply attach to the surface of Au NPs, therefore increasing their resistance to salt-induced aggregation.
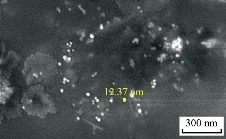
Fig. 3 FESEM image of 5.0 nM Au NPs solution.
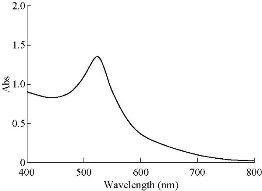
Fig. 4 UV-Vis spectrum of Au NPs.
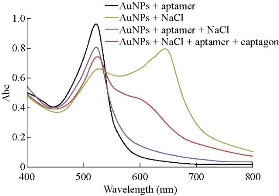
Fig. 5 UV-Vis absorption spectra of Au NPs under diverse experimental conditions (Concentration of NaCl = 200 mM, concentration of aptamer = 20 μM, and concentration of Au NPs = 5.0 nM), conforming to the visual color variation.
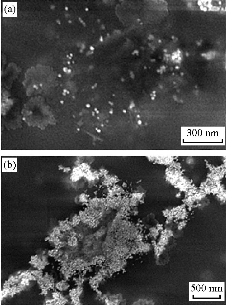
Fig. 6 (a) FESEM image of 5.0 nM Au NPs solution. (b) FESEM images of 5.0 nM Au NPs solution in the presence of 0.33 μM aptamer and 5.0 μM Captagon after the addition of 33.3 mM NaCl .
Optimization of experimental conditions
In order to obtain the optimum condition for the Captagon detection, various parameters such as NaCl, MgCl2,CTAB and aptamer concentration, temperature and reaction time on aggregation of Ag NPs were examined. The volume of each sensing system was fixed at 300 mL and the volume of Au NPs added to each sensing system was set at 150 mL. The absorbance values at 520 nm (A520) and 650 nm (A650) were measured, and the absorbance ratio A650/A520 was recorded to designate the aggregation degree of Au NPs. The change in the absorbance ratio value was calculated to evaluate the change in the aggregation degree of Au NPs. Fig. 6 shows that the spectra change of the mixture at 200 mM NaCl was higher in its slope than those at other NaCl concentrations. Therefore, 0.2 M of NaCl was determined as the optimal salt concentration inducing the most distinct color change with 20 µM of Captagon. Besides NaCl concentration, the Captagon aptamer concentration is a critical-factor that affects the analytical performance of the assay for Captagon detection; therefore, optimization of the aptamer concentration is important. As seen in Fig. 8, the effects of aptamer concentration on the absorbance intensity ratio in the presence of Captagon were checked. In the presence of Captagon, the absorbance intensity ratio remained high and slightly increased with increasing aptamer concentration. Fig. 8 shows the increase of absorbance intensity ratio; maximum was obtained at aptamer concentration of 20 nM. Therefore, 20 nM was determined as the best aptamer concentration. As seen in Fig. 9, at varying incubation time, absorbance ratio reached maximum at 5 min, which indicated the fast kinetics between the Captagon aptamer and Captagon. To achieve optimal analytical performance of this aptamer-based assay, the optimal time was determined at 5 min that was adopted in the subsequent studies. Fig.10 shows the influence of temperature on the variation in the absorbance-ratio (A650/A520) of the assay solution, and the concentration of Captagon was 20 μM. The absorbance ratio increased with the increasing of temperature until reaching plateau. The optimal temperature was 50 ℃, indicating the temperature needed to reach the full reaction.
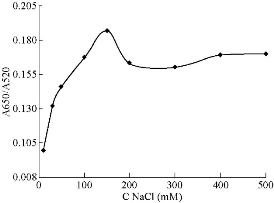
Fig. 7 The NaCl concentration-dependent absorbance intensity ratio (A660/A525) change of Au NPs solution.
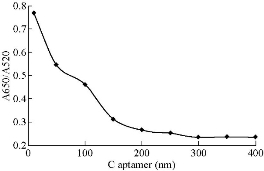
Fig. 8 The aptamer concentration-dependent absorbance intensity ratio (A660/A525).
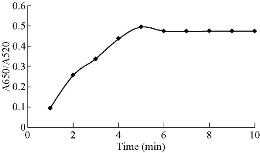
Fig. 9 Effect of absorbance ratio (A660/A525) of the assay solution as a function of time. Concentration of Captagon was 20 μM.
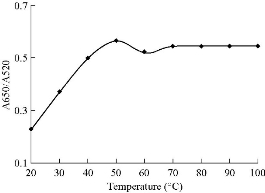
Fig. 10 Effect of absorbance ratio (A660/A525) of the assay solution as function of temperature. Concentration of Captagon was 20 μM.
Captagon standard curve
The standard calibration curve was planned to calculate the Captagon concentration that was detected in biological sample including urine, blood and hair. Ratio of the absorbance intensity (A650/A520) as presented in Fig.11 was linearly linked to the amount of Captagon in the range of 2 - 50 μM, which was suitable for the quantification of Captagon with a correlation coefficient of 0.998.
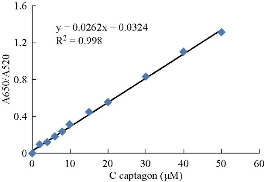
Fig. 11 The standard curve of Captagon concentration, showing a linear relationship between the absorbance ratio (A650/A520) and different concentrations of Captagon from 2 to 50 μM.
Selectivity of the assay
To verify the selectivity of the present colorimetric assay for Captagon detection, the absorbance ratio (A650/A520) of aptamer stabilized Au NPs solution was measured in the presence of a variety of competing licit drugs such as Paracetamol, Lidocaine, Allermine, Butalin and Amoxicillin. As shown in Fig. 12, an obvious change both in absorption spectra and in visual color was observed upon the addition of Captagon, while small and insignificant change occurred in the presence of any inspected substances with the same concentration as Captagon. The results indicated that the present colorimetric assay showed reasonable specificity towards Captagon detection against other competing drugs.
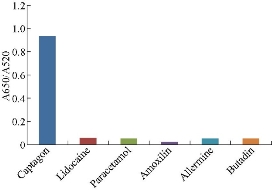
Fig. 12 Selectivity of the assay for Captagon detection, showing relationship between the absorbance ratio (A650/A520) and different competing licit drugs measured at the concentration of 20.0 μM.
Selectivity for illicit drugs
To examine the selectivity of the Captagon-sensing system, different analogues of Captagon and competing illicit drugs, including methamphetamine, tramadol, Artane, Valium, and dexamethasone were added separately in a given sensing solution. The absorbance of each sample was monitored and the change in the absorbance ratio of each sample was compared. As shown in Fig. 13, Captagon caused the most obvious absorbance ratio increase. However, it should be noted that some of the assayed metal ions could instigate slight interferences, which indicates that interference may be significant if those ions exist at high concentrations. Therefore, appropriate measures should be developed to make this assay more practical for further application.
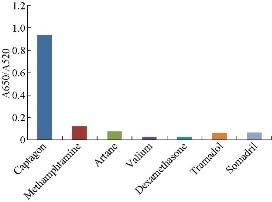
Fig. 13 Selectivity of the assay towards Captagon detection, showing relationship between the absorbance ratio (A650/A520) and different competing illicit drugs measured at the concentration of 20.0 μM.
Analysis of real human samples
Application of the current assay was evaluated for the detection of Captagon in some biological samples including urine, blood and hair chosen from prisoners who were drug abusers in Alkarkh Prison, Baghdad. Concentrations of Captagon in these biological samples were calculated by equation according to standard curve of Captagon: y = 0.0262x + 0.0324, where y was absorbance ratio and x was the unknown concentration.
Urine analysis
Samples of urine were collected-from 5 male subjects 1 - 3 days after abuse of Captagon, and the detected concentrations of Captagon in urine were checked as shown in Table 1. Captagon disappeared from urine in 3 - 4 days after aduse of Captagon. In such a case, it would be difficult to distinguish between Captagon and amphetamine used in urinalysis. Captagon concentrations ranged from 4.381 to 7.034 µM, and the absorbance ratio A650/A520 was from 0.147 to 0.216 (Table 1).
Table 1 The absorbance ratio and detected concentrations in urine
|
Sample |
A520 |
A650 |
Ratio (A650 / A520) |
Conc. (µM) |
|
1 |
0.194 |
0.014 |
0.208 |
6.702 |
|
2 |
0.195 |
0.021 |
0.216 |
7.008 |
|
3 |
0.124 |
0.022 |
0.146 |
4.336 |
|
4 |
0.148 |
0.019 |
0.167 |
5.137 |
|
5 |
0.139 |
0.021 |
0.160 |
4.870 |
Human blood samples were collected from 5 male subjects addicted to Captagon one day after Captagon abuse. Captagon concentrations ranged from 1.099 to 3.374 µM, and the absorbance ratio A650/A520 was from 0.061 to 0.121 (Table 2). Captagon disappeared from blood in 12 h after addiction. In such a case, it would be difficult to distinguish between Captagon and amphetamine used in blood analysis.
Table 2 Absorbance ratio and detected concentrations in blood
|
Sample |
A520 |
A650 |
Ratio (A650/A520) |
Conc. (µM) |
|
1 |
0.071 |
0.010 |
0.081 |
1.855 |
|
2 |
0.081 |
0.039 |
0.120 |
3.344 |
|
3 |
0.047 |
0.014 |
0.061 |
1.092 |
|
4 |
0.056 |
0.038 |
0.094 |
2.351 |
|
5 |
0.090 |
0.008 |
0.098 |
2.504 |
Hair analysis
Scalp hair of human subjects who were addicted to Captagon was collected 3 - 4 weeks after Captagon abuse. The near 1-cm hair sections were examined. Captagon concentrations ranged from 0.290 to 0.824 µM, and the absorbance ratio A650/A520 was from 0.042 to 0.054 (Table 3). Large separate differences concerning the concentration of drug in biological samples were found among the subjects, with the concentration of drug in urine 2.5 times larger than that in blood and 12.1 times greater than that in hair. Additionally, ratios of Captagon were diverse among these subjects. Furthermore, there was no considerable relationship between the quantity of addiction and the drug concentration in hair. In drug abuse history, there was a big difference found among 15 checked subjects; they all gave positive colorimetric tests compared with just 6 subjects for urinalysis and 5 subjects for blood analysis as illustrated in Fig. 14, indicating that illicit drugs disappeared form blood within 12 h compared with urine which disappeared through 3 - 4 days, but illicit drugs remained for more time for 28 - 90 days. Our findings displayed that hair was a good example for detection of drug history of Captagon and other illicit drugs, which was identical to the study of Mieczkowski and coworkers [23].
Table 3 Absorbance ratio and detected concentrations in hair
|
Sample |
A520 |
A650 |
Ratio (A650 / A520) |
Conc. (µM) |
|
1 |
0.035 |
0.009 |
0.044 |
0.443 |
|
2 |
0.047 |
0.007 |
0.054 |
0.824 |
|
3 |
0.031 |
0.011 |
0.042 |
0.366 |
|
4 |
0.034 |
0.009 |
0.043 |
0.405 |
|
5 |
0.032 |
0.008 |
0.040 |
0.290 |
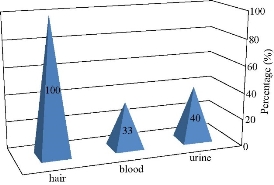
Fig. 14 Differences among concentrations of subjects checked.
Conclusions
In brief, we have developed a novel colorimetric plan based on Au NPs and designed aptamer to precisely determine Captagon in real human samples qualitatively. In this method, a specific aptamer with 40 bases served as recognition moiety, and the color of Au NPs worked to indicate the ligand- induced structure change of the aptamers. The colorimetric assays offered the benefit of suitability of a visual assay. The current assay was rapid and flexible, since no more surface functionalization was necessary for the as-prepared Au NPs. Particularly, the current assay could not merely function in aqueous solution for Captagon detection but also displayed sensitive responses towards Captagon in complex biological environments such as human urine, blood and hair, indicating its possibilities as a powerful tool for specific and sensitive Captagon detection in-field. It is supposed to represent a widely appropriate aptamer-based detection scheme.
Conflict of Interests
The authors declare that no competing interest exists.
References
Copyright© Abbas Alfadly, Ali Abdulwahid, and Afrodet Saleh. This is an open-access article distributed under the terms of the Creative Commons Attribution License, which permits unrestricted use, distribution, and reproduction in any medium, provided the original author and source are credited.

|
Nano Biomedicine and Engineering. Copyright © Shanghai Jiao Tong University Press |
 |