Research Article
Probabilistic Neural Network Based Fatigue Level Classification Using Electrocardiogram High Frequency Band and Average Heart Beat
Mousa Kadhim Wali
Department of Computer Engineering, College of Technical Electrical Engineering, Middle Technical University, Baghdad, Iraq.
* Corresponding author. E-mail: drmusawali4@gmail.com
Received: Jan. 16, 2020; Accepted: Apr. 13, 2020; Published: Apr. 14, 2020
Citation: Mousa Kadhim Wali, Probabilistic Neural Network Based Fatigue Level Classification Using Eelectrocardiogram High Frequency Band and Average Heart Beat. Nano Biomed. Eng., 2020, 12(2): 132-138.
Abstract
The detection of fatigue level is important because it is the main reason of sudden death. This research depended on the average heartbeat of the electrocardiogram signal, and the features were extracted from its high frequency components. Therefore, there is great need to transform signal into frequency domain by discrete wavelet transform. In this research, 6 features were supplied to probabilistic neural network which gave accuracy of 60.56% of detecting high level among other levels of medium and low fatigue. This research studied the fatigue on 40 students due to mathematical exercises in a noisy environment with different stimuli.
Keywords: Electrocardiogram; Average heartbeat; Discrete wavelet transform; Probabilistic neural network.
Introduction
Fatigue is the main factor that affects human life of motivation, cognition, perception, creativity, decision-making, learning and attention [1]. A lot of approaches to diagnosing fatigue have been used, including the use of questionnaires, biochemical measures and physiologic techniques. Most of these methods are subject to experimental errors and must be viewed with caution [2]. When the brain suffers stress, the sympathetic nervous system (SNS) will let the former to respond by increasing heart rate variability (HRV) which is controlled by the sympathetic and parasympathetic autonomic nervous systems (ANS) [3]. When human body is exposed to stress stimuli, it will respond physiologically through increasing activities of hypothalamic-pituitary-adrenal (HPA) axis in addition to increasing the sympathy of adrenal system (SAS) [2]. A lot of research has been undertaken in assessment of fatigue and emotion over the last years. Most research studied the fatigue based on peripheral signals such as respiratory rate, skin conductance (SC), blood volume pulse (BVP), temperature [4], electromyogram (EMG), skin temperature (ST), galvanic skin response (GSR), HRV, and blood pressure (BP) [5]. Some researchers studied the high frequency (HF) and low frequency (LF) bands from HRV signals for stress classification [6]; however, only several researchers used real data, and their validity for detecting the true psychological stress was hampered because of inherent limitations in defining the ground truth of assessing the stressful events [4]. The aim of this study was to investigate fatigue level classification based on the HF part of electrocardiogram (ECG) signal by extracting its statistical features along with the average heartbeat (AHB). The weakness of previous works concerned extracting features from time domain rather than frequency domain which was suitable in analyzing the physiological signals to obtain finer information about time-frequency information, and concerned using minimum number of subjects. These downsides have been overcome in the present work by using wavelet transform with 40 subjects.
Experimental
Acquisition protocol
In this work, we considered math-audio stimuli to induce fatigue under various environments. ECG signal was collected by Analog Digital (AD) instrument with sampling frequency of 256 Hz from 40 healthy male students, in the age range from 20 to 29 years old. The subject should wear 3 electrodes, with the first one on the right hand, the second on the left hand, and the third on the left leg (Fig. 1). The protocol let the subject perform 3 difficult levels of arithmetic mathematics (MAT) tasks to induce fatigue along with different stimuli such as a hot room, lack of sleep, engine noise, stomach being full, and finally boredom of repeating questions. The ECG HF band signal was used to extract the required features in order to classify fatigue levels as normal (1 min) with taking AHB readings, low (10 min) with AHB readings increased by 10%, medium (10 min) with AHB readings increased by 15%, and high (10 min) with AHB readings increased by 25%. This experiment was repeated for each subject 3 times in different days, and thereby the average of each fatigue section in addition to the normal state was taken from several heartbeat readings to get more accurate results. In addition, the mathematic exercises were combined with audio distraction to affect cognition of the subject by adding mental demands [7]. It is very important to assess fatigue by increasing the fatigue level from the easy to the difficult by complicating the mental state [8, 9].
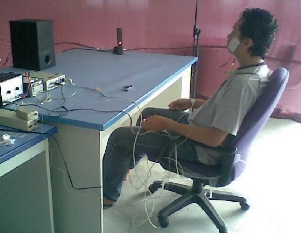
Fig. 1 Placement of electrodes on the subject.
Preprocessing
ECG signal was an electrical signal with amplitude between 0.5 to 4 mV with its important information lying in the range of 0.05 - 100 Hz and distorted by 3 types of predominant noises, namely low frequency artifacts (0.04 - 0.15 Hz), high frequency artifacts (0.18 - 0.4 Hz) and 50 Hz power line interference. The frequencies beyond the required range were eliminated by using a 6th order Butterworth filter (Equation (1)) which is also very efficient in reducing the baseline wander because this type of filter is fast for signal processing and can be designed to have possible flat frequency response with no ripples in the pass band and with zero roll off response in the stop band.
Power line interference could easily be identified because it had a frequency of 50 Hz with a level greater then ECG signal. A well-known qualified method of reducing the power line interference that uses infinite impulse response (IIR) is called notch filter which can be designed to remove very specific narrow band frequencies completely and to pass most required frequencies unaltered [10]. The center frequency of this 4th order notch filter was 50 Hz with bandwidth of 1 Hz. Transfer function of the notch filter is demonstrated in Equation (2). Fig. 2 shows clearly the difference between the ECG signals before and after filtering.
![]() (2)
(2)
Where ![]() is the central rejected frequency and
is the central rejected frequency and ![]() is the width of the rejected band.
is the width of the rejected band.
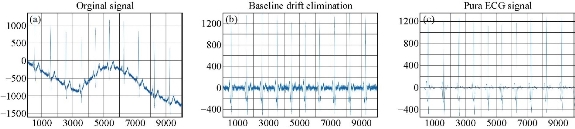
Fig. 2 (a) Original ECG; (b) ECG after removing baseline wander; and (c) ECG after removing high frequency.
Experimental setup
Firstly, the preprocessed (0 - 100 Hz) ECG signal was transformed to frequency domain by the discrete wavelet transform (DWT) which decomposed the signal into any approximation (CA) and detail coefficient (CD) level, as shown in Equation 3 and 4 respectively [11].
![]() , (3) and
, (3) and
![]() , (4)
, (4)
where M is the number of wavelet filter coefficients, b is the wavelet transform level, k is the approximation or detail coefficient item at any level, while hi is the low pass filter coefficient and gi is the high pass filter coefficient, which are derived from the scaling and wavelet functions respectively and to be multiplied separately either by the input signal or by the resultant approximation and details coefficients. The basic relation between the sampling frequency (Fs = 256 Hz) and frequency range of sub bands at any level (b) is ![]() for approximation coefficient and
for approximation coefficient and ![]() for detail coefficient. Previous researchers used "db4", "coif5" and "sym7" wavelet functions for ECG signal processing because their shapes were very similar to the ECG waveform [12, 13], and therefore these wavelets were chosen in this research. The ECG frequency range was 0 - 100 Hz and the HF was 0.18 - 0.4 Hz band which could be obtained from detail coefficients of level 13 of DWT as shown in Fig. 3 based on the mentioned wavelets according to Equation (5) [11].
for detail coefficient. Previous researchers used "db4", "coif5" and "sym7" wavelet functions for ECG signal processing because their shapes were very similar to the ECG waveform [12, 13], and therefore these wavelets were chosen in this research. The ECG frequency range was 0 - 100 Hz and the HF was 0.18 - 0.4 Hz band which could be obtained from detail coefficients of level 13 of DWT as shown in Fig. 3 based on the mentioned wavelets according to Equation (5) [11].
![]() . (5)
. (5)
It is important to mention that the range of M in Equation (5) was from 0 - 7 over the summation interval of Equation (5) for db4 wavelet. This interval was from 0 - 4 and from 0 - 6 for coif5 and sym7 respectively. In this research, the HF (0.18 - 0.4 Hz) features including minimum, maximum, mean, standard deviation, mode, energy, median and variance were used to measure the fatigue levels using AHB of ECG.
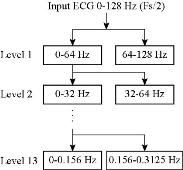
Fig. 3 DWT levels of ECG signal sampled by 256 Hz frequency.
Probabilistic neural network (PNN)
The probabilistic network consisted of 4 layers as shown in Fig. 4, namely input layer, hidden layer, summation layer and output layer. PNN was a simple classifier based on the probability density function. It had input, pattern, summation and output units. All these units were interconnected and the pattern unit was activated based on the computed distance from the input vector to the testing vectors. The used function in PNN was the logistic as a common type of sigmoid function which was defined by Equation 6.
![]() , (6)
, (6)
where x represents each sample in the supplied vector. This function based on smoothing parameter or spread factor as the factor could be used to decide the nonlinear decision boundaries of each classification problems. The hidden layer was learned from the input layer through computing its activation nodes by multiplying the input vector with weight matrix and then applying the activation function. The summation layer consisted of several summation units that simply summed the inputs from the pattern units corresponding to the category from which the training pattern was selected. The complete architecture and methodologies were developed by Specht [14]. In this work, an extensive dataset was collected from 40 subjects using 4 different stimuli, namely a hot room, lack of sleep, engine noise, stomach being full, and finally boredom along with math exercises. Hence, the overall vectors over 4 fatigue levels were 800 vectors (40 subjects × 5 stimuli × 4 levels) for ECG HF band on one statistical feature. Therefore, the overall data input for 8 statistical feature was 6400 values (800 × 8) and the total number of the overall values over 3 sessions was 19200 (6400 × 3) being supplied to the PNN classifier. 3 possible outputs could be derived from this fatigue detection system. The outputs were denoted as 1 for low level, 2 for medium level and 3 for high level fatigue. At any specific time, only one output would be present to notify the fatigue level of the subject. This proposed work was aimed to utilize 70% (560 vectors) for training and remaining 30% (240 vectors) was used for testing the system. In this PNN classifier, a smoothing factor of 0.1 value was used to classify the fatigue level.
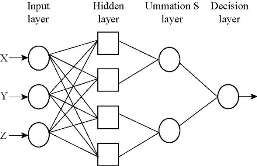
Fig. 4 The PNN structure.
Results and Discussion
In order to obtain desired data, the ECG data underwent several signal processing methods. In this research, 3 different wavelet functions were performed for feature extraction of the HF band of the EEG spectrum as shown in Fig. 5. These wavelets, namely db4, coif5, and sym7 were down-sampling ECG levels by 2, i.e. reducing the number of samples to half as shown in Fig. 6. This figure illustrates how db4 transformed the ECG up to level 4. After DWT, it was easy to get the features of the HF band of the ECG; minimum, maximum, mean, standard deviation, mode, energy, median and variance were classified by PNN to 3 fatigue levels. As demonstrated in Table 1, with energy feature, db4 gave the highest accuracy of 70.66%, 68.43% and 67.46% for low, medium and high levels respectively among coif5 and sym7 wavelets as shown in Fig. 7. And the reason was that Daubechies wavelets could approximate to signals with spikes and discontinuous. In particular db4 wavelet was specialised for nonlinear feature extraction [14, 15]. Meanwhile, coif5 was showing accuracy of 64.44%, higher than sym7 (64%) in classifying high stress based on mode feature. In the meantime, under db4, it is important to analyse by graph as shown in Fig. 8 that the energy feature was the dominant one compared with other features of classification results for all the fatigue levels. It is very important to detect the high-level fatigue because it is very dangerous for people’s life. Fig. 9 explains of different wavelets and features as a proof for the dangerous fatigue captured easily by db4 and energy feature. From the above results, we concluded that it was necessary to analyse the difficult arithmetic tasks along with different stimuli (a hot room, lack of sleep, engine noise, stomach being full, and finally boredom) under only db4 and energy feature as illustrated in Table 2. It is very clear that noise activated high level of fatigue with high accuracy of 60.56% compared to other stimulus, while stomach being full generated the lowest value of 36.46%. Table 3 shows the comparison of the fatigue classifications between the present work and previous ones. The results revealed clearly that the proposed technique was capable of classifying three different levels of fatigue with a suitable mean classification rate by lower computation complexity of energy feature extracted from HF band of ECG depending on AHB and DWT. From Table 3, based on DWT, a classification rate of 94.66% was achieved at the highest accuracy in the study on classifying 2 classes by Karthikeyan, as compared to 84.8% in the study done by Athira, as the latter depended on time domain feature extraction. This led us to taking advantage of using DWT in our present work instead of Welch’s method which resulted in 83.9% accuracy in Seo’s research. Shon’s research produced the lowest accuracy of 71.76% for classifying 2 stress classes due to the use of EEG features in time domain which was another reason for not taking EEG signal in our present work. Amira’s work depending upon time domain features obtained 87% accuracy because of using LF and HF frequencies. Therefore our present work depended on DWT for extracting ECG HF band features for classifying 3 fatigue classes rather than 2. Based on db4 wavelet and energy feature, the PNN classifier produced 60.5% accuracy with engine noise stimulus in classifying high fatigue compared to low and medium levels. Nevertheless, there was another state-of-the-art method by extracting features from wavelet decomposition of the ECG image intensity using artificial neural network (ANN). This ANN was trained by the main features of the 63 ECG images getting classification accuracy of 92% [22]. Therefore, this led to new future work based on ECG images to detect happened time of patient stress. Finally, the present work can be used for real time system applications but it needs more data on accuracy by involving more subjects in the research so as to get a larger sample number and by using robust classifier such as a fuzzy classifier.
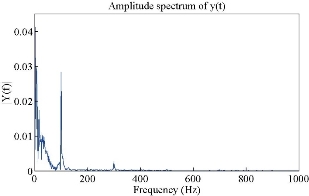
Fig. 5 ECG spectrum.
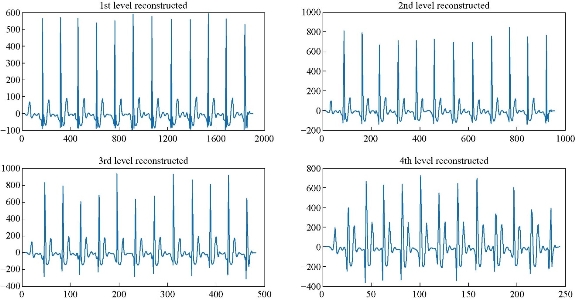
Fig. 6 Level 4 decomposition of ECG by db4.
Table 1 Classification of fatigues levels using wavelet functions.
|
Feature |
Db4 |
Coif5 |
Sym7 |
||||||
|
low |
Medium |
High |
Low |
Medium |
High |
Low |
Medium |
High |
|
|
Mean |
43.88 |
66.11 |
61.11 |
44.46 |
64.00 |
62.22 |
46.66 |
66.68 |
61.66 |
|
Std. deviation |
46.68 |
40.46 |
64.00 |
60.00 |
41.11 |
64.00 |
48.44 |
40.00 |
64.00 |
|
Mode |
62.22 |
48.88 |
64.00 |
63.33 |
63.33 |
64.44 |
62.22 |
63.88 |
64.00 |
|
Energy |
70.66 |
68.43 |
67.46 |
67.66 |
64.11 |
58.68 |
61.11 |
60.11 |
55.68 |
|
Median |
43.88 |
61.66 |
46.22 |
42.68 |
60.00 |
48.88 |
44.00 |
46.66 |
62.68 |
|
Variance |
40.46 |
33.88 |
60.00 |
41.11 |
34.44 |
61.11 |
40.46 |
34.00 |
61.66 |
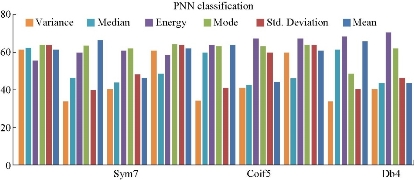
Fig. 7 PNN classification of different fatigue levels under various wavelets and features.
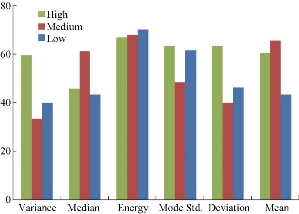
Fig. 8 Fatigue levels of classification under db4 for different features.
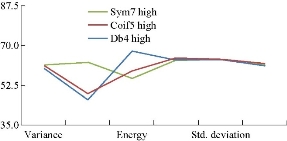
Fig. 9 PNN classification of high level fatigue of each feature under different wavelets.
Table 2 PNN classification of fatigue levels under db4 and energy feature for different stimuli
|
db4 |
State level |
Lack of sleep |
Stomach being full |
Engine noise |
Hot room |
Boredom |
|
Low |
63.72 |
61.68 |
60.38 |
59.49 |
61.35 |
|
|
Medium |
44.44 |
46.46 |
44.73 |
49.77 |
48.66 |
|
|
High |
40.18 |
36.46 |
60.56 |
56.37 |
54.45 |
Table 3 Comparison of classifications of present work with previous works
|
Reference |
Physiological signals |
Data base |
Feature extraction |
Classifier and number of classes |
Accuracy (%) |
|
Karthikeyan [17] |
ECG & HRV |
60 subjects |
DWT |
kNN, 2 classes |
94.66 |
|
Athira [18] |
ECG & HRV |
-- |
Time domain features |
Level detection, 2 classes |
84.8 |
|
Shon [19] |
EEG |
17 subjects |
Time domain features |
GA, PCA & kNN, 2 classes |
71.76 |
|
Wonju [20] |
ECG & RESP |
18 subjects |
Welch’s method |
CNN, 2 classes |
83.9 |
|
Tlija [21] |
HRV |
53 subjects |
LF/HF ratio |
SVM, 2 classes |
87 |
|
Present work |
ECG |
40 subjects |
DWT |
PNN, 3 classes |
60.56 |
Note: kNN = k-nearest neighbours; GA = genetic algorithm; PCA = principle component analysis; RESP = respiration; CNN = convolutional neural network; SVM = support vector machine.
Conclusions
Most of the research works have discussed the classification of fatigue into 2 classes based on ECG frequency bands. This work presented features (mean, standard deviation, mode, energy, median and variance) of HF band of the ECG signal based on DWT of wavelet families, namely Daubechies db4, Symlets sym7 and Coiflet coif5, to classify 3 fatigue classes (low, medium and high). The proposed methodology was tested on 40 subjects and provided maximum accuracy of 70.66%, 68.43% and 67.46% of classifying low, medium and high fatigue respectively, using db4 wavelet and energy feature with PNN classifier. Noise activated fatigue of different levels with a higher accuracy compared with other tasks; it produced high level fatigue with 60.56% accuracy, which can be improved by applying a fuzzy classifier in future works.
References
Copyright© Mousa Kadhim Wali. This is an open-access article distributed under the terms of the Creative Commons Attribution License, which permits unrestricted use, distribution, and reproduction in any medium, provided the original author and source are credited.

|
Nano Biomedicine and Engineering. Copyright © Shanghai Jiao Tong University Press |
 |