Research Article
Synthesis of ZnO Nanorod/TiO2 Nanotube and its Application as a Resistive Gas Sensor
Marwa Abdul Muhsien Hassan *, Nazar Khalaf Mahan *
Department of Physics, College of Science, Mustansyriah University, Baghdad, 00964, Iraq.
* Corresponding authors. E-mail: marwamedicalphysics@uomustansiriyah.edu.iq; marwamedicalphysics@gmail.com
Received: Jul. 15, 2020; Accepted: Dec. 19, 2020; Published: Jan. 27, 2021
Citation: Marwa Abdul Muhsien Hassan, Nazar Khalaf Mahan, Synthesis of ZnO Nanorod/TiO2 Nanotube and its Application as a Resistive Gas Sensor. Nano Biomed. Eng., 2021, 13(1): 44-51.
DOI: 10.5101/nbe.v13i1.p44-51.
Abstract
In this study, different chemical methods were used to synthesize ZnO nanorod, TiO2 nanotube and ZnO/TiO2 nanostructure as high sensitivity vapor sensor for ethanol. The surface topography of ZnO nanorod, TiO2 nanotube and ZnO/TiO2 was studied by using the scanning electron microscopy (SEM). The X-rays diffraction showed the appearance of (101) ZnO which has single crystalline with a hexagonal wurtzite while TiO2 has been crystallized in a tetragonal with the preferential orientation of the crystallinity with the prominent (111). The relation between resistance-time showed high sensitivity for ZnO/TiO2 and was found to be around 20-80% at different working temperature. ZnO/TiO2 sensor was the most sensitive to ethanol vapor.
Keywords: ZnO nanorod, TiO2 nanotube, ZnO/TiO2, Gas sensor, SEM
Introduction
Two-dimensional nanomaterials should have a scale of two dimensions of less than 100 nm. Nanotubes including TiO2 nanotubes and nanofibers, as well as nanowires are important examples for this class of materials [1-10]. TiO2 nanotubes and ZnO nanorods are used as supporting and reinforcing materials for metal molds to raise their hardness values and improve their mechanical properties, and in particular to raise their resistance to collapse, as they are distinguished by other unique properties such as superior thermal and electrical conductivity [11-20]. The nanotubes, nanorods and nanowires are expected to be used in the manufacture of components for solar cells, electronic chips, sensors and microelectronic devices [21-25]. Gas Detectors check the concentration of certain gases in the air with various techniques, which prevent poisoning to people or fires to industrial equipment and plants, and are usually used for industrial safety purposes [26-30]. They are manufactured in the form of portable gas detectors or fixed type gas detectors to obtain continuous monitoring of the plant and equipment and it works to inform the technician or engineer of the presence of high levels of gases through audio or visual indicators that alert the presence of high or dangerous rates of these gases as is the case in Alarms at stations. It is a means of alerting of the occurrence of a gas leak inside the plant [31-37]. There is also a third type of sensor that can be installed temporarily in places that contain fixed sensors that have been withdrawn for maintenance or calibration purposes. Smaller (mobile) sensors can be used for testing in atmospheric air in a specific location, to track gas leaks, or to give early warning of the presence of flammable gases when performing hot work such as welding or cutting in closed or semi-closed spaces in dangerous areas [38-43]. In this paper, TiO2 nanotubes and ZnO nanorods were prepared using chemical methods under the best conditions for the purpose of using them as highly efficient gas sensors.
Experimental
Preparation of TiO2 nanotube
Before electrochemical anodization, titanium (Ti) foils (250 μm thick, purity 97%) with a size of 1 cm × 2.5 cm were degreased by ultra-sonication in a mixture of acetone, methanol, and methylene chloride for 30 min, followed by washing with a large amount of distilled water and drying with N2. Electrochemical anodization was carried out in a two-electrode cell using a power source PS-3030, where the Ti foil was used as the anode and a thin platinum foil was used as the counter electrode as shown in Fig. 1. Anodization electrolytes were fabricated by mixing ethylene glycol (EG, 99.5 %,) with ammonium fluoride (NH4F, 0.5%). Each potential static anodization was performed under the room temperature of ~23 °C, after a certain period of anodization, i.e., 4 h, the Ti foil was immediately washed with a large amount of DI water and subsequently dried with N2 to induce the crystalline phase.
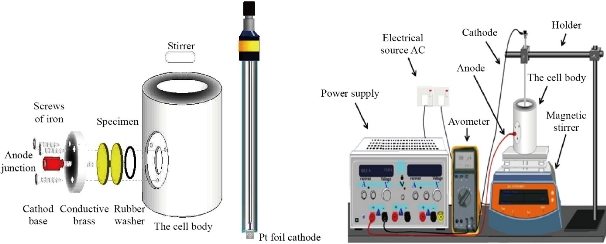
Fig. 1 Schematic diagram of the anodic oxidation cell.
Preparation of ZnO nanorods
Zinc nitrate was used as a main source of zinc ions to prepare ZnO nanorods by using a hydrothermal method. A large beaker was used to dissolve a specific amount of zinc nitrate in deionized water. After that, NH4OH was added gradually. For the purpose of obtaining high homogeneity, the solution was stirred for 0.5 h under the influence of continuous magnetic stirring. Then, the solution was transferred to a sealed Teflon cell with a capacity of 100 ml. After 1-day reaction at 180 ℃. Fig. 2 shows the gas sensor system that has been equipped to measure the response of samples as gas sensors. The crystal structure of the prepared ZnO, TiO2 and ZnO/TiO2 films was examined using the SHIMADZU X-ray diffraction device (XRD-6000) and scanning electron microscope Hitachi (S-4160) (SEM).
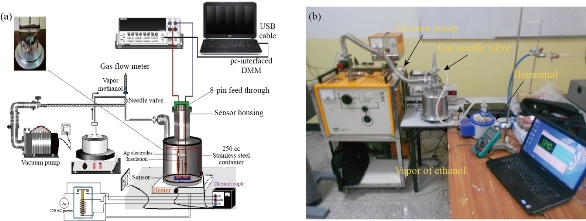
Fig. 2 (a) Gas sensor testing system, and (b) picture of sensor testing system.
Results and Discussion
Structural characterization for ZnO nanorods and TiO2 nanotube arrays
Fig. 3 shows XRD patterns of ZnO nanorods array was fabricated by chemical method, with the diffraction peaks (101) at 2θ = 34°. The significantly higher intensity of the (101) diffraction peak indicated that the hydrothermally grown ZnO rods were preferentially oriented in the c-axis and had a high degree of orientation property results, which was in good agreement with previous reports [10-15]. XRD pattern characteristics for TiO2 nanotube can be shown in Fig. 4. The peaks at 2θ of 38.91°, 40.69°, 53.52°, 63.49°,71.09°,76.62° and 77.80°" corresponded to (112), (111), (105), (312), (401), (202) and (242), respectively (JCPDS No .21-1272, 29-1360) for the sample fabricated at room temperature. The peaks of (111) at 2θ = 40.69° were much stronger than other peaks; no peaks for Ti foil were observed in the TiO2 nanotubes. The peak positions and their relative intensities were consistent with the standard powder diffraction pattern of anatase TiO2 and there was no preferred orientation. It was demonstrated that all of the peaks could be attributed to that the polycrystalline anataseTiO2 phase was formed through the electrochemical anodic oxidation. A good crystallinity of TNTs was noticed in the results, which was in good agreement with previous reports [20-25]. Fig. 5 presents XRD patterns of ZnO nanorods grown into aligned TiO2 nanotube array. Table 1 shows the crystal size for all samples. Typical SEM images of ZnO branched nanorods grown on glass substrate are shown in Fig. 6. A close observation reveals that the individual ZnO with hexagonally shaped were grow along the c-axis with the average diameter, surface area and length of about (30-70 nm), 260 m2/gm and ~480nm, good crystallinity and uniform size of ZnO nanorod arrays are observed, indicating the perfect growth process of ZnO nanorods, The nanorods are exhibiting hexagonal surfaces and facets throughout their lengths which confirm that the nanorods are well-crystalline results are in good agreement with [20-27]. Scanning electron Microscopy image of the TiO2 nanotubes is shown in Fig. 7(a). Ordered array of nanotubes with uniform diameter and length was formed; open end and the hollow nature of the TiO2 nanotubes were straight and dense. Diameters of these nanotubes ranged to be 30 ~ 60 nm, retaining the size and near cylindrical shape of the pores, with surface area 290 m2/gm; the result is in agreement with previous reports [30-36]. Fig. 7(b) shows the SEM image of the as-prepared ZnO nanorods grown into aligned TiO2 nanotube array obtained by chemical process heating at 160 °C for 24 h. It can be seen that aligned ZnO nanorods with hexagonal rod like structure were grown on the TiO2 nanotube arrays. At this electro deposition stage, the grown ZnO hexagonal rods had higher density and more ordered surface morphologies, which indicated the electro deposition process had conducted thoroughly at electro deposition time of 60 min. All of the grown ZnO hexagonal rods had nearly the same diameter of ~50 nm, which is similar with the diameter of TiO2 nanotubes. Deduced from the SEM observation, the electro deposition process of ZnO hexagonal rods on TiO2 nanotube arrays can be concisely depicted as the initial electro deposition of ZnO hexagonal rods on the substrates and was a heterogeneous nucleation process. Fig. 8(a) shows the EDX spectrum for the ZnO nanorods whose seed layer grew on glass substrate. The EDAX spectrum also confirmed the rods grown were ZnO with zinc and oxygen combined at the ratio of 1:1.04 as calculated from EDX and quantitative analysis data. It revealed that the compound percentage for ZnO and O was 30.51 and 43.25, respectively as listed in Table 2. The other elements C, Na, W, Al and Na that were not expected to be in the deposited films may result from the glass substrates or from the firing of some part of layers of the deposited films during the growth process. Major components of TiO2 nanotube are titanium and oxygen with compound percentage for Ti and O as of 32% and 12%, respectively (Table 2).
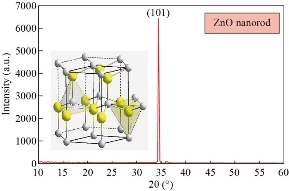
Fig. 3 XRD pattern of the ZnO nanorods prepared by chemical method.
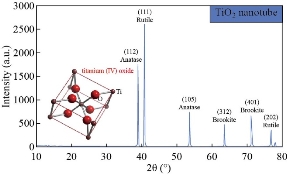
Fig. 4 XRD patterns of TiO2 nanotube.
Table 1 Results of XRD to measuring crystal size for all samples
|
Samples |
Crystal size |
|
ZnO nanorod |
150 nm |
|
TiO2 nanotube |
70 nm |
|
ZnO nanorod / TiO2 nanotube |
65 nm |
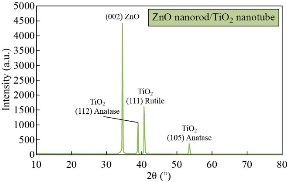
Fig. 5 XRD patterns of ZnO nanorods grown into aligned TiO2 nanotube array.
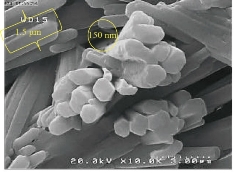
Fig. 6 SEM of the ZnO nanorods prepared by chemical method.
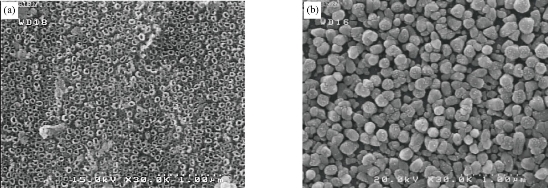
Fig. 7 SEM of (a) TiO2 nanotube arrays and (b) ZnO nanorods / TiO2nanotube array.
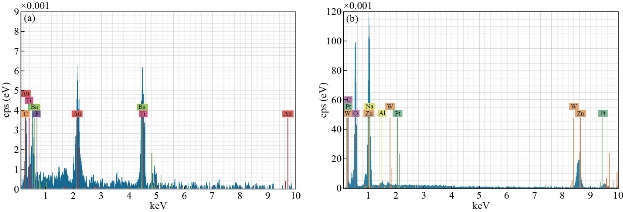
Fig. 8 EDX spectra of (a) ZnO nanorods and (b) TiO2 nanotube.
Table 2 Compound percentage of the ZnO nanorods and TiO2 nanotube
|
Element |
TiO2 nanotube |
ZnO nanorods |
|
Carbon (C) |
6.57 |
4.329 |
|
Oxygen (O) |
11.99 |
43.25 |
|
Fluorine (F) |
1.80 |
-- |
|
Sodium (Na) |
-- |
6.18 |
|
Titanium (Ti) |
31.46 |
-- |
|
Barium (Ba) |
28.11 |
-- |
|
Aluminum (Al) |
-- |
0.56 |
|
Gold (Au) |
20.04 |
-- |
|
Zinc (Zn) |
-- |
30.51 |
|
Tungsten (W) |
-- |
9.33 |
|
Total |
100 |
100 |
Sensing properties for ZnO nanorods, and TiO2 nanotube
TiO2 nanotube array, ZnO nanorod and ZnO/TiO2 sensor at different working temperatures and concentrations (100, 200, 400, 600 and 800 ppm), as shown in Fig. 9. Some nanomaterials like TiO2 nanotube array, ZnO nanorod and ZnO/TiO2 are delicate materials that distinguish fumes when the gas comes into contact with surface molecule, the TiO2 nanotube, ZnO nanorod and ZnO/TiO2 exhibit changes through physical properties, for example, through electrical conductivity. Oxygen has an extremely incredible adsorption impact. Oxygen noticeable all around at room temperature would be adsorbed actually on the TiO2 nanotube array, ZnO nanorod and ZnO/TiO2 surface. At the point when certain energy is acquired, oxygen would be adsorbed on the TiO2 nanotube array, ZnO nanorod and ZnO/TiO2 sensor surface as an adsorption compound. The essential types of substance retention oxygen are O2ads−, Oads−, and O ads2 −, which are identified with the room temperature. The practical results demonstrate that at low temperatures, the oxide surface exists as a molecular ion O2ads−, and changes into a type of an atomic ion Oads− and Oads2− with the ascent in temperature. At higher more than 177 °C, Oads− controls the surface oxygen adsorption. In this paper, the employed temperature of the sensor was 200 °C [36-40]. The fume ethanol under goes an ionic response with the surface adsorption oxygen, eliminates an electron, delivers once more into the conduction band and causes the conductivity of the TiO2 nanotube array, ZnO nanorod and ZnO/TiO2 materials to expand, consequently making the opposition be diminished. As such, the TiO2 nanotube sensor plays a detecting capacity. This finding is predictable with the exploratory outcomes. Albeit the TiO2 nanotube exhibit, ZnO nanorod and ZnO/TiO2. TiO2 nanotube array, ZnO nanorod and ZnO/TiO2 slight film semiconductor are diverse in microstructure and structure, the above semiconductor adsorption system is reasonable for clarifying the fume sensor reaction of the TiO2 nanotube array, ZnO nanorod and ZnO/TiO2 respectively. As seen in Fig. 9, the 100 ppm fume ethanol experiment wash be rehashed once, and it was discovered that the sensor reaction was decreased, and the obstruction couldn’t get back to the underlying worth. This outcome is because of the remaining warm deterioration of ethanol particles fixed in the TiO2 nanotube array, ZnO nanorod and ZnO/TiO2 as the consequence of synthetic adsorption. The adsorption energy of compound adsorption is a lot bigger than the actual adsorption capacitance; subsequently, unadulterated fume ethanol flushing the sensor and low-temperature warming are not adequate to eliminate totally the ethanol atoms on the sensor by substance adsorption. Fig. 10 demonstrates the affectability of the sensor increments with the ascent in its functional temperature, for example, the overall attributes of n-type semiconductor. At the point when the temperature reached 200 °C, the sensor reached its most extreme affectability at half. At the point when the operating temperature continued torise, the affectability tended to be soaked and decline fundamentally. Accordingly, the best operating temperature is around 200 °C for TiO2 nanotube array, ZnO nanorod and ZnO/TiO2 gas detector (Fig. 11). Table 3 shows the response and recovery time of pure ZnO, TiO2 and ZnO/TiO2 with different conditions at operation temperature and vapor gas concentration. High sensitivity and good suitable for concentration ZnO/TiO2 gas sensors were observed.
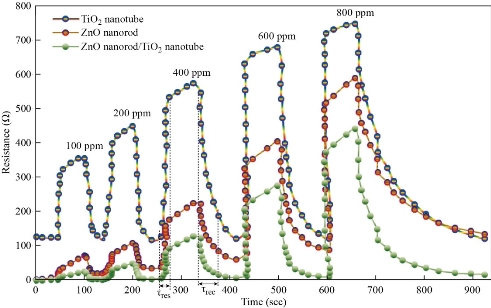
Fig. 9 Resistance for ZnO nanorods, TiO2 nanotube and ZnO/TiO2 as a function of operating time.
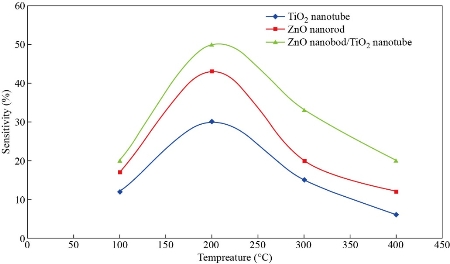
Fig. 10 Sensitivity of ZnO nanorods, TiO2 nanotube and ZnO/TiO2 as a function of operating temperature for vapor ethanol.
Table 3 Comparative of response and recovery time of pure ZnO, TiO2 and ZnO/TiO2 prepared at different conditions
|
Sample |
Response time (sec) |
Recovery time (sec) |
|
ZnO nanorod |
12 |
53 |
|
TiO2 nanotube |
15 |
55 |
|
ZnO nanorod / TiO2 nanotube |
10 |
44 |
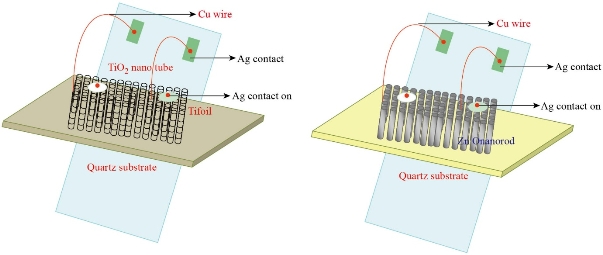
Fig. 11 Scheme for TiO2 nanotube and ZnO nanorod/TiO2 nanotube gas detector.
Conclusions
In the current study, the vapor-sensitive characteristics of the TiO2 nanotube array, ZnO nanorod and ZnO/TiO2 sensor were tested with 100 ppm vapor ethanol at surface temperatures ranging from 100 to 400 °C. The response time was in the range of 10~20 sec, and the recovery time was found to be around 40~60 sec. The sensitivity of the sensor increased with the rise in its working temperature such as the general characteristics of n-type semiconductor. When the temperature reached 200 °C, the sensor reached its maximum sensitivity at 50%. When the working temperature continued to rise, the sensitivity tended to be saturated and decreased basically. Therefore, the best working temperature was about 200 °C for TiO2 nanotube array, ZnO nanorod and ZnO/TiO2 gas detector.
References
Copyright© Marwa Abdul Muhsien Hassan, Nazar Khalaf Mahan. This is an open-access article distributed under the terms of the Creative Commons Attribution License, which permits unrestricted use, distribution, and reproduction in any medium, provided the original author and source are credited.

|
Nano Biomedicine and Engineering. Copyright © Shanghai Jiao Tong University Press |
 |