Research Article
Fabrication of N-Doped Graphene@TiO2 Nanocomposites for Its Adsorption and Absorbing Performance with Facile Recycling
Pravin Onkar Patil 1*, Sopan Namdev Nangare 1, Pratiksha Pramod Patil 1, Ashwini Ghanashyam Patil 2, Dilip Ramsing Patil 2, Rahul Shankar Tade 1, Arun Madhukar Patil 2, Prashant Krishnarao Deshmukh 3, Sanjay Baburao Bari 1
1 H. R. Patel Institute of Pharmaceutical Education and Research, Karvand Naka, Shirpur, Dist- Dhule, Maharashtra, 425405 India.
2 R. C. Patel Arts, Science, and Commerce College, Shirpur, Maharashtra, 425405 India.
3 Dr. Rajendra Gode College of Pharmacy, Malkapur, Dist- Buldhana, Maharashtra, 443101 India.
* Corresponding author. E-mail: rxpatilpravin@yahoo.co.in
Received: Dec. 11, 2020; Accepted: Mar. 29, 2021; Published: May 26, 2021
Citation: Pravin Onkar Patil, Sopan Namdev Nangare, Pratiksha Pramod Patil, Ashwini Ghanashyam Patil, Dilip Ramsing Patil, Rahul Shankar Tade, Arun Madhukar Patil, Prashant Krishnarao Deshmukh, and Sanjay Baburao Bari, Fabrication of N-Doped Graphene@TiO2 Nanocomposites for Its Adsorption and Absorbing Performance with Facile Recycling. Nano Biomed. Eng., 2021, 13(2): 179-190.
DOI: 10.5101/nbe.v13i2.p179-190.
Abstract
The present work aims to synthesize nitrogen-doped reduced graphene oxide-titanium dioxide nanocomposite (N-rGO@TiO2) using a simple, eco-friendly method and its applications in spectroscopic detection of heavy metal ions such as lead (Pb2+), mercury (Hg2+), and chromium-VI [Cr(VI)] in potable water. Initially, TiO2 nanoparticles loaded N doped rGO sheets were fabricated by an ecological method using Gossypium hirsutum (cotton) seeds extract as a green reducing agent. Then, the N-rGO@TiO2 nanocomposites were subjected for characterizations such as spectroscopic techniques, particle size analysis, zeta potential analysis, and spectroscopic sensing. Notably, the results of this study confirmed that N-rGO@TiO2 exhibited countless stupendous features in terms of sensing of an analyte. Briefly, the UV-visible spectroscopy and Fourier transform infrared (FTIR) spectroscopy confirmed the successful synthesis of N-rGO@TiO2. The SEM images showed the wrinkled, folded, and cross-linked network structures that confirmed the surface modification and nitrogen doping in the rGO sheet and synthesis of N-rGO@TiO2. The EDAX study confirmed the elemental composition of the N-rGO@TiO2 nanocomposite. Finally, due to the larger surface area, porous nature, high electron mobility, etc. the N-rGO@TiO2 probe provides the lower detection limit for Pb2+, Hg2+, and Cr (VI) as low as 50 nM, 15 µM, and 25 nM, respectively. Concisely, our study affirms the admirable sensitivity of N-rGO@TiO2 nanocomposite to the Pb2+, Hg2+, and Cr (VI) in potable water can provide better environmental remediation.
Keywords: Graphene oxide, N-rGO@TiO2, Nanocomposite, Cotton-seed, Heavy metals, Biodegradable, Sensing
Introduction
Over the past two decades, graphene-based materials are gaining tremendous attention from a scientific fraternity in various fields [1-3]. It may because of its astonishing properties and potential to revolutionize the scientific sector [3-5]. Graphene can be used to fabricate several dimension materials such as 1D nanostructure [6], 2D layer stacked films [7], 3D graphene hydrogel [7-9], and aerogel [10-13], etc. Out of various properties, graphene exhibited a high surface area in contrast to carbon nanotubes (CNTs) [14]. Also, it significantly enhances the electrochemical activity of various metal oxides such as titanium dioxide (TiO2), zinc oxide (ZnO), etc). Several reports mentioned that the graphene in combination with photocatalysts resulted in the enhancement of the adsorption of pollutants [15-17]. Interestingly, several scientific groups are working on the conversion of graphene into a different unique form of graphene. On this account, the further modification of graphite (graphene) through oxidation gives the utmost graphene oxide (GO) [13, 18] and other structural models [13, 19-21]. Herein, GO exhibited abundant oxygen functionalities including carboxyl, epoxy and hydroxyl [22-24]. This GO containing oxygen functionalities, structural defects [25, 26] can be used for a range of applications. Further continuous development in GO leads to the synthesis of reduced GO (rGO). On this account, several methods have been reported for the rGO but they have some demerits such as influences of original electronic properties of graphene. Majorly reported methods can lead to ion doping and there is a chance of the presence of aggregate in nanocomposites. Besides, the uses of chemical reducing agents for the synthesis of rGO are hazardous, potentially explosive, and highly toxic to human health plus environments. Therefore, there is a need to stay away from the use of such toxic chemical agents. On this account, several eco-friendly green reducing agents (biomolecules, plant extracts and microbes) have been reported for the synthesis of rGO that acts as a capping agent and reducing agent [27]. Plenty of plant metabolites have been utilized for the fabrication of rGO for example plant extracts containing amino acids, vitamins, saccharides, microorganisms, proteins, etc. [28, 29]. Briefly, Zhang et al. reported vitamin C as a reductant for GO in combination with L-tryptophan [30]. Gou and co-workers confirmed that GO can be reduced using L-cysteine (amino acid) [31]. In a similar line, Dong et al. reported the synthesis of rGO using reducing sugar (fructose, glucose) [32]. Overall, these novel green synthesis approaches are based on several methods such as solvothermal, hydrothermal, electrochemical, microwave, and UV irradiation approaches [24]. It means the broader interest in green chemistry and environmentally sustainable synthesis of GO could be contributing to many new approaches for reducing GOs as excellent alternatives to traditional chemical processes. From its inception, titanium dioxide (TiO2) is extensively used in various pharmaceutical formulations such as toothpaste, ointments, paints and sunscreens. Furthermore, TiO2 has attracted significant attention in material chemistry and it has been well investigated by the research scholars. It may because of its strong redox ability, long-term stability against photo-corrosion and chemical corrosion, relative non-toxicity, and excellent optical plus electrical properties [27, 28, 33]. On the other hand, the photocatalytic potential of TiO2 is restricted owing to its low photocatalytic sensitivity in the UV region and the fast recombination of photogenerated electron-hole pairs [29, 31]. In this line, the photocatalytic performance of TiO2 can be increased by optimizing optical absorption and charge transfer characteristics. It is worth mentioning that the photocatalytic performance of TiO2 can be improved when combining with types of graphene-based nanocomposites [34-36]. In the last few years, several heteroatoms including boron (B), phosphorus ( P), sulfur ( S), and nitrogen ( N) have been successfully explored in sensing applications. The heteroatom doped nanocomposites lead to an improvement in overall required characteristics of novel synthesized material for sensing of different interest analyte [37, 38]. Among these above mentioned heteroatoms, the doping of N is of notable interest as of its electron-rich nature, comparable size to that of carbon and high electronegativity of ‘N’, which might provide an appropriate location to fit into the graphene lattice. The finally obtained ‘N’ doped graphene composites can be used for various applications [39-43]. In the line of doping-based sensing, the majority of investigations have been focused on N-doping only. Remarkably, it is well known to induce favorable changes like increasing conductivity into the carbon material [38, 44] and high activity in the redox reactions in fuel cells [45]. As per literature, the synthesis of N-doped carbon material can be achieved through several pathways including post-treatment of carbon with ammonia [46], amines, or urea [47] and also it can be synthesized using more direct approaches using acetonitrile [48], pyrrol [49], polyacetonitrile [2, 50] as starting compounds. As we know, the numbers of heavy metals naturally present in the environment that is in the normal range. unfortunately, during development in a different sector, the amount of heavy metals in nature is rising rapidly. it may due to various manufacturing and smelting activities. in addition to that, old infrastructure water sources, pollution from vehicles, polluted paint, different fertilizers, plastic, etc. are also helped to raise the level of heavy metals [51]. it is worth mentioning that most developed and under developing countries are suffering from issues of heavy metal pollution [52]. nowadays, it becomes a major problem. in addition to that, presently we are suffering good quality water shortages due to water contamination. in this framework, the various pollutants including heavy metals are harmful to human beings plus the environment. it majorly affects the quality of the naturally available water. besides, because of the presence of such heavy metals, it causes many health issues such as gastrointestinal diseases, muscular diseases, tumors, reproductive diseases, neurological diseases, genetic disorders, etc [51]. therefore, there is a need to detect the level of heavy metals in potable water and separate it. numbers of research groups are working on the detection and separation of such water contaminants. nevertheless, most of the approaches are suffering from some hurdles such as sensitivity, selectivity. also, the chemically synthesized materials for sensing pollutants are limited its applications due to the use of toxic chemicals for the synthesis of such nanocomposites [51, 53-55]. In this attempt, we have synthesized N-rGO@TiO2 nanocomposites for sensing heavy metal ions. Initially, we synthesized N-rGO@TiO2 via fixing of TiO2 nanoparticles on GO sheets by a simple, green, eco-friendly, single-step method wherein cottonseeds extract is used as a green reducing agent. Finally, the spectroscopic detection of heavy metal ions from the potable water was investigated using stable N-rGO@TiO2 nanocomposite. As a result, the N-rGO@TiO2 nanocomposites based spectroscopic detection of Pb2+, Hg2+, and Cr (VI) ions exhibited a good ability to detect these heavy metal ions in potable water efficiently. Taken as a whole, N-rGO@TiO2 could be a simple, rapid and economic method for heavy metal detection in water. In the future, our present work can encourage the N-rGO@TiO2 based future applications to remove Pb2+, Hg2+, and Cr (VI) ions from potable water.
Experimental
Materials
Graphite flakes (particle size 8 µm, 99.9995%) were gifted by Asbury Carbons, New Jersey, USA. All of the chemicals utilized in this present work were of analytical grade and applied as received without further purification. Green source, cotton-seed was collected from the cotton processing center, Shirpur (MS), India.
Synthesis of graphene oxide
Initially, GO was synthesized using a modified Hummers method followed by slight modification [56]. In brief, sulfuric acid (H2SO4) and phosphoric acid (H3PO4) in the ratio of 27 mL: 3 mL were mixed properly followed by stirring for 15 min using a magnetic stirrer at 200 rpm. Subsequently, 0.225 g of graphite powder was added into the above mixture with constant stirring. After that, 1.32 g of potassium permanganate (KMnO4) was added slowly into the previous graphite powder mixture followed by stirring up to 6 hrs until the color of the mixture became dark green. Then, hydrogen peroxide (H2O2, 0.675 mL) was dropped slowly followed by stirring for 10 min to eliminate the excess of KMnO4. After completion of the reaction, the obtained mixture was cooled at room temperature. Furthermore, this mixture was purified three times by using hydrochloric acid (HCl) and DDW (1:3 ratio) and centrifuged using a cold centrifuge at 7000 rpm (for 20 min at 25 °C). Finally, the obtained product was dried at 60 °C for 24 h.
Synthesis of N-rGO@TiO2 nanocomposite
Firstly, the following steps were implemented for the preparation of the N-rGO@TiO2 nanocomposite. Initially, GO (75 mg) was dispersed into 10 mL of DDW followed by continuous stirring at room temperature (200 rpm). Then, sonication of nanocomposites was completed for 30 min. After that, the collected cotton seed powder (50 mg) was added into 50 mL of DDW and refluxed for 1 h. After that, the seed extract was filtered and further concentrated by centrifugation (7500 rpm for 30 min) using a cold centrifuge (Refrigerated Centrifuge, Elteck Overseas Pvt., India). The obtained concentrated filtrate was used for further phytochemical testing and the nanocomposite synthesis process. Simultaneously, TiO2 dispersion was prepared by dispersing 50 mg TiO2 into 10 mL DDW followed by sonication for 30 min. After that, cotton seed extract GO and TiO2 dispersions were mixed (2:6:2) and heat on a water bath for 6 h (90 oC). Consequently, the obtained composite was freeze-dried using a laboratory freeze dryer (Freezone12, Labconco, MO, USA). The N-rGO@TiO2 composite was prefreezed at – 30 °C for 12 h. After that, the primary drying of N-rGO@TiO2 composites was performed at –53 °C and 0.016 mbar for 24 h. Then, the secondary drying of N-rGO@TiO2 composites was performed at 10 °C for 8 h followed by drying at 25 °C for 4 h with a gradual increase in temperature at 1°C/min. Finally, the temperature of the cold trap was maintained at –53 °C until the completion of the drying process. This resulted in N-rGO@TiO2 composite powder was further used for subsequent evaluation studies.
Characterization of N-rGO@TiO2 nanocomposite
The synthesized GO and N-rGO@TiO2 nanocomposite was characterized by various spectroscopic techniques. Initially, the UV-visible spectra of GO and nanocomposite were recorded between 800-400 nm through UV 1800 spectrophotometer (Shimadzu, Japan) using a quartz cuvette. The functional groups of GO and N-rGO@TiO2 nanocomposites were examined using an IR spectrophotometer (DRS 8000 IR spectrophotometer Shimadzu 8400s, Japan) and scanned over a wave range of 4000-400 cm-1. The morphology and elemental analysis of GO and N-rGO@TiO2 nanocomposite were examined under a scanning electron microscope (SEM) with 15 kV acceleration voltage and interpretation was carried out on Bruker, 1530-2 FESEM/EDX, Germany. The particle size analysis, as well as zeta potential of synthesized GO and N-rGO@TiO2 nanocomposite, were measured using Nanoplus 3 Particulate System (Micromeritics, USA). Composite shape, size, were analyzed by using High-Resolution Transmission Electron Microscope (HR-TEM, Jeol/JEM 2100) using the LaB6 light source at 200kV.
Spectroscopic sensing of heavy metal ions by N-rGO@TiO2 nanocomposite
Sensing of Pb2+ by N-rGO@TiO2 nanocomposites
The selective detection of Pb2+ was performed by UV visible spectroscopic method. Typically, a stock solution of 1 mM lead (II) chloride (PbCl2) in water was prepared in DDW. After that, 1 mL of 10 nM, 25 nM, 50 nM, 250 nM, 500 nM, 1000 nM, 2500 nM, 5×10³ nM, 75×102 nM and 1×10⁴ nM concentrations of Pb2+ were added into separate vials. Simultaneously, N-rGO@TiO2 nanocomposite solution (1mg/mL) was prepared in DDW. Then, 2 mL of N-rGO@TiO2 nanocomposite solution was added above different test tubes. Similarly, the real-time sensing of the Pb2+in spiked sample was performed using N-rGO@TiO2 nanocomposites. In that, 100 nM concentration of Pb2+ was added into vials containing 2mL of N-rGO@TiO2 nanocomposite. After thorough shaking, the color change in the test tube solution was observed by the naked eye followed by a recording of UV-Vis absorption spectra from 800-200 nm.
Sensing of Hg2+ by N-rGO@TiO2 nanocomposites
The absorption spectra of the N-rGO@TiO2 nanocomposite were recorded by adding different concentrations of Hg2+. In brief, the different concentration (10 μM, 15 μM, 50 μM, 100 μM, 250 μM, 500 μM, 1000 μM) of HgCl2 were prepared. Then,1mL of this solution was added into 2 mL of N-rGO@TiO2 nanocomposite solution followed by shaking and subjected to 2 min as a resting time. The changes in the N-rGO@TiO2 nanocomposite absorbance band with the addition of diverse concentrations of Hg2+ were monitored by recording absorption spectra from 800 nm-200 nm. For detection, the different Hg2+ concentrations were added separately into the N-rGO@TiO2 nanocomposite solution followed by mixing and allowed to rest. Finally, real-time sensing of Hg2+ was performed in a spiked sample using N-rGO@TiO2 nanocomposites. In that, 75 µM concentration of Hg2+ was added into vials containing 2mL of N-rGO@TiO2 nanocomposite. The color changes in vials were observed with the naked eye followed by a recording of UV-Vis absorption spectra from 800-200 nm.
Sensing of Cr (VI) by N-rGO@TiO2 nanocomposites
The detection of Cr (VI) was performed using N-rGO@TiO2 through UV visible spectroscopic method. Firstly, the stock solution of 1 mM K2Cr2O7 was prepared in DDW. Simultaneously, N-rGO@TiO2 nanocomposites solution (1 mg/mL) was prepared in DDW. Herein, 1 mL of 10 nM, 25 nM, 50 nM, 250 nM, 500 nM, 2500 nM, 5×10³ nM, 75×102 nM, and 1×10⁴ nM were added in separate vials. Then, 2 mL of N-rGO@TiO2 nanocomposites solution was added into previously prepared vials. Real-time sensing of Cr(VI) in a spiked sample was performed using N-rGO@TiO2 nanocomposites. In that, 50 nM concentration of Cr(VI) was added into vials containing 2mL of N-rGO@TiO2 nanocomposite. After thorough shaking, the color changes in the solution were observed by recoding UV-Vis absorption spectra from 800 - 200 nm.
Results and Discussion
The phytoconstituents screening of cotton-seed extract was showed the presence of carbohydrates, proteins, amino acids, tannins, phenols, alkaloids, and flavonoids, etc [57]. Due to the presence of phytoconstituents, the green synthesis of rGO-based nanocomposites can be possible [58].
UV-vis absorption study
The UV absorption spectra of GO and N-rGO@TiO2 nanocomposite are depicted in Figure 1. In brief, Figure 1A demonstrates that the GO dispersion exhibited an intense absorption peak at 232 nm (λmax) which corresponds to π- π* transitions of an aromatic ring containing C-C bonds and slightly low intense shoulder peak at 300 nm due to graphene, n-π transitions of C-O bonds, respectively. Based on this, it confirmed the synthesis of GO. The UV Visible spectrum was conducted to investigate the optical absorption capability of the N-rGO@TiO2 nanocomposite, as shown in Figure 1. The TiO2 dispersion exhibited the characteristic absorption at around 350 nm in the UV region. However, a gradual red-shift to longer wavelengths was observed for the N-rGO@TiO2 nanocomposite fabricated using the one-pot method. The red-shift absorption was attributed due to the construction of the Ti-O-C bond, which reduces the band-gap energy of the N-rGO@TiO2 nanocomposites. On the other hand, it gets hybridized with O 2p and C 2p atomic orbital under high pressure and temperature. Also, the introduction of ‘N’ into the graphene nanosheet resulted in the high absorption intensity as compared to the plain TiO2 [59]. So, it confirmed that the shift in the absorption in the UV-Vis range of N-rGO@TiO2 is due to N-doping.
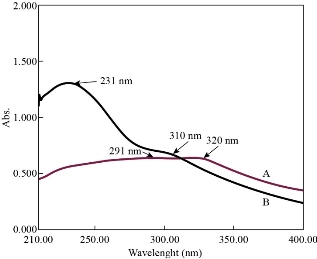
Fig. 1 UV visible spectra of (a) GO and (b) N-rGO@TiO2 nanocomposite.
FTIR analysis
FTIR analysis GO and N-rGO@TiO2 are depicted in Figure 2. Figure 2A shows a broad-band around 3300 cm-1 that confirmed the stretching vibrations of O-H groups in GO. The various prominent vibrational bands (cm-1) for GO were observed at ~2900 cm-1, 2800 cm-1, 1730 cm-1, 1400 cm-1, 1200 cm-1, and 1030 cm-1, which have been assigned to symmetrical C-H stretching, unsymmetrical C-H stretching, C=O stretching, O-H bending, C-O-C stretching and C-O stretching, respectively [60]. Therefore, we conclude that the flourishing synthesis of GO. Figure 2B confirmed that the FTIR spectrum of N-rGO@TiO2 nanocomposite shows a band at ~3561 cm-1, 3120 cm-1, 2947 cm-1 that confirmed the N-H stretching vibrations, O-H stretching, C-H stretching, respectively. Furthermore, the peaks at 1670 cm-1 and 1556 cm-1 which are correspond to the C=N and C=O stretching and vibration mode. The peak corresponds to C=O stretching, vibration in GO was decreased due to the reduction of oxygen functionalities. The peak at 1228 cm-1 and 1041 cm-1 was observed due to C-O stretching vibration. Two peaks were also observed for Ti-O-C and Ti-O-Ti at 673 cm-1 and 497 cm-1, respectively [61]. It may due to the interaction of TiO2 with rGO sheets. Therefore, based on the FTIR, we conclude that the synthesis of N-rGO@TiO2 nanocomposite. Herein, FTIR spectra of GO confirmed that the presence of oxygen functionalities such as –COOH, -OH, etc. when TiO2 nanoparticles mixed with GO, the nanoparticle get fixed on the surface of the GO sheet due to the bonding between TiO2 and GO that form the new bonds such as –COO-. After the successful reduction of GO in nanocomposites, the free nanoparticles are entrapped into the 3 D structure of nanocomposites via physical entrapment. Finally, it gives the 3D self assemble nanosized, stable hydrogel [62].
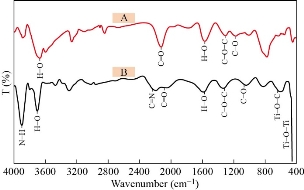
Fig. 2 IR spectra of (a) GO and (b) N-rGO@TiO2 nanocomposites.
Scanning electron microscopy and high-resolution transmission electron microscopy
Generally, the SEM is used to confirm the surface morphology of materials. Based on this, it facilitates the verification of synthesis of nanocomposites. Herein, Figure 3A and Figure 3B shows a wrinkled and typical crumpled surface. Also, the sheets are stacked together and form a typical multi-layer structure of GO. Normally, the wrinkled arrangement of GO sheets offers a great rough surface. Besides, due to such unique nature of GO sheets, it offers more surface for doping of heteroatoms [61]. Figure 3C and Figure 3D show the SEM images of the N-rGO@TiO2 nanocomposite that confirms the surface morphological microstructures of the N-rGO@TiO2 nanocomposite. As per Figure 1 A and B, the GO sheets show wrinkled and folded form, whereas nanocomposites showed cross-linking of TiO2 nanoparticles on the surface of the GO sheet that formed the network structures in N-rGO@TiO2 nanocomposite. The HR-TEM image of the N-rGO@TiO2 nanocomposite is shown in Figure 3 E. The TEM analysis demonstrates that the spherical shapes TiO2 nanoparticles are distributed and attached on the surface of the rGO sheet. The size distribution of TiO2 nanoparticles in N-rGO@TiO2 nanocomposite was found to be 42 nm to 115nm. Besides this, the anchoring of TiO2 was found on the sheet of the rGO, it might because of the chemical bonding and physical entrapment of nanoparticles into the mixture of graphene. The morphology of ‘N’ doped nanocomposite showed the stacked layer of graphene thin layers that resulted in the multilayered graphene nanosheet. Notably, the curled edge and fold appearance in nanocomposite was credited to the defect structure, which may be caused due to the ‘N’ doped graphene sheet [59]. Overall, the SEM and HRTEM images confirmed the rough surface of the N-rGO@TiO2 nanocomposite. It may because of the attachment of TiO2 nanoparticles on the stable dispersion of the nanosized rGO sheet. The formation of nanocomposites meant that the restored conjugated arrangement of GO sheets reduces and functionalized using CSE in an aqueous medium. Overall, it indicates partial overlapping and aggregation of flexible GO sheets via π- π stacking interaction resulted in 3D graphene porous network. During the synthesis of the nanocomposite, the GO containing oxygen functional groups might be notably reduced during synthesis process. Interestingly, the π–π intrinsic interaction between rGO is slowly restored in nanocomposites. Furthermore, the slight overlapping and coalescing of flexible nanosized rGO converted into the 3D porous nanostructure. During the synthesis of the composite, the nanoparticle completely decorates the rGO sheets. It helps to avoid the aggregations of graphene nanosheets. Automatically, it improves the volume and surface areas of nanocomposites. Fascinatingly, TiO2 nanoparticles also provide the bridge to connect the RGO nanosheets via chemical bonding, and finally, it is converted into the pores with smaller size. Simultaneously, π–π intrinsic conjugation gets weakened in rGO and it provides a high quantity of TiO2 anchoring on the surface of 3D graphene sheet [63].
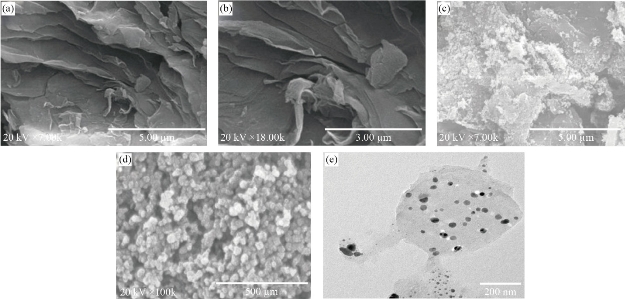
Fig. 3 The SEM images of (a) and (b) GO, and (c) and (d) N-rGO@TiO2 nanocomposites; the HRTEM image of (e) N-rGO@TiO2 nanocomposite.
Elemental analysis by EDAX
The elemental composition of nanocomposites plays an important role for to achieve the highly sensitive detection of the analyte. In this context, the EDAX provides the details of elements present in the composition. In this report, Figure 4A demonstrates the EDX spectra of GO, which confirmed the presence of carbon (C) and oxygen (O) at about 34.31 wt % and 64.69 wt %, respectively. As per literature, the presence of ‘O’ confirmed the different ‘O’ functionalities are present on the surface of the GO sheet. It provides the bonding among different metal ions, which helps to sense the interest analyte. Besides, it also acts as an intermediate for nanocomposite synthesis. The doping of ‘N’ in nanocomposite can confirm based on the percent composition of ‘N’ present in the final formulation. In this report, figure 4 B provides the EDAX spectrum of N-rGO@TiO2 nanocomposites. In brief, EDAX spectra of N-rGO@TiO2 confirmed that the 1.45 wt % of ‘N’ and 43.77 wt % of ‘C’ were present in the nanocomposite. The analysis of EDAX spectra showed a significant decrease in ‘O’ about 38 wt %. It may due to the doping of ‘N’ on the GO sheets. Furthermore, the content of ‘Ti ‘was found to be 16.78 wt %. Therefore, based on the existing elements such as N, C, O, Ti, confirmed the complete formation of N-rGO@TiO2 nanocomposite.
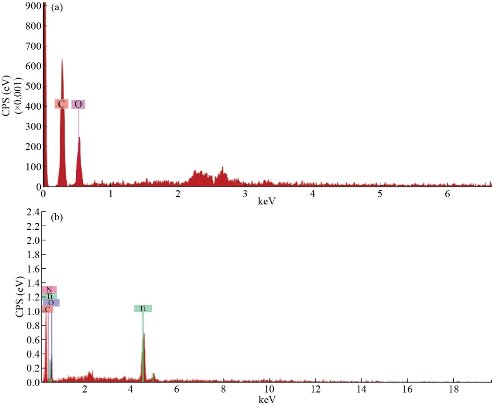
Fig. 4 EDX spectra of (a) GO and (b) N-rGO@TiO2 nanocomposites.
Particle size and zeta potential analysis
Particle size analysis is performed to confirm the distribution (or average diameters) of nanomaterials, whereas zeta potential provides the information about the stability of nanocomposite. Figure 5A demonstrates the particle size distribution of synthesized GO. Herein, the average diameter of GO was found to be 81.2 nm (Figure 5A). The polydispersity index of GO dispersion was found to 0.42, which confirmed the uniform distribution of GO nanosized sheets in dispersion. The zeta potential analysis of GO dispersion was found to be - 23.00 mV (Figure 5B). Therefore, it confirmed the uniform distribution and stability of nanosized GO sheets in dispersion. Figure 6A provides the particle size distribution of the N-rGO@TiO2 nanocomposite. The average particle size of the N-rGO@TiO2 nanocomposite was found to be 357.6 nm that assured the synthesis of the N doped nanosized composite. The polydispersity index of nanocomposite was found to be 0.51 that confirmed the uniform distribution of nanocomposite in water. The zeta potential analysis of N-rGO@TiO2 is depicted in Figure 6B. The nanosized composites showed a positive zeta potential of about + 29.55 mV, which confirmed the stability of the nanocomposite and successful doping of N into the rGO sheet. Overall, based on these findings, it confirmed that the N-rGO@TiO2 composite exhibited the nanosized distribution and high stability in dispersion.
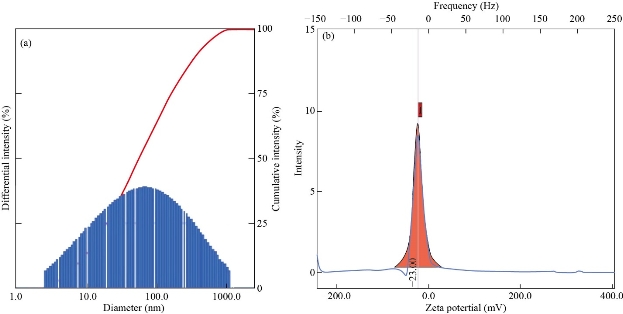
Fig. 5 (a) Particle size and (b) zeta potential of GO.
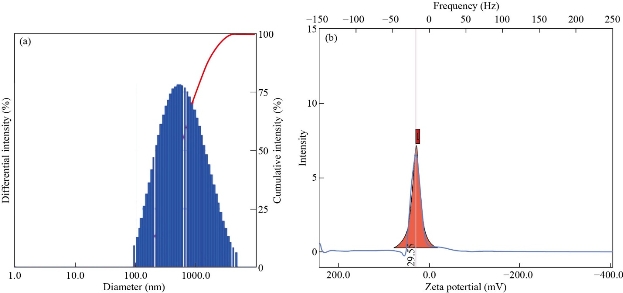
Fig. 6 (a) Particle size and (b) zeta potential of N-rGO@TiO2 nanocomposite.
Spectroscopic sensing of Pb2+, Hg2+, and Cr (VI) by N-rGO@TiO2 nanocomposites
In this study, the synthesized N-rGO@TiO2 nanocomposite was checked for the spectral as well as optical detection of the above mentioned heavy metal ions. The details of the sensing study are discussed in the respective subsection.
Sensing of Pb2+
The synthesized N-rGO@TiO2 nanocomposite was tested for the spectral and optical detection of Pb2+ ions. In brief, the detection of Pb2+ ions by N-rGO@TiO2 nanocomposite revealed that the UV-visible spectra absorption peaks decreased with an increasing concentration of Pb2+ ions are shown in Figure 7. The changes in the UV spectra of the N-rGO@TiO2 nanocomposite solution help to calculate the nM concentration of Pb2+ ions (r2=0.0074x+0.08). In this study, nanocomposites intensity dramatically decreased with an increasing amount of Pb2+ ions. The sudden change was observed at 50 nM concentration. Therefore, the detection limit of Pb2+ was found to be 50 nM. After the addition of 1×10⁴ nM concentration of Pb2+ ions into the N-rGO@TiO2 composite solution, the characteristic peak completely disappeared. It may due to the loss of characteristic properties of nano-region after the strong aggregation of N-rGO@TiO2 aerogel at this high concentration of Pb2+. The spiked sample analysis was showed the 100 nM concentration of Pb2+ in the waste-water. Overall, upon addition of Pb2+ ions in the N-rGO@TiO2 solution turned colorless that induced by aggregation of N-rGO@TiO2 aerogel, which was detected visually and also confirmed by UV spectroscopy.
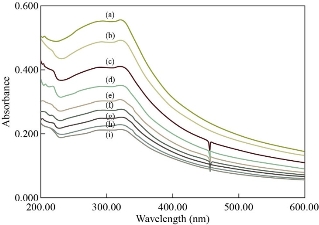
Fig. 7 Spectroscopic sensing of Pb2+ by N-rGO@TiO2 nanocomposite: (a) 0 nM, (b) 50 nM, (c) spiked sample (100 nM), (d) 250 nM, (e) 500 nM, (f) 1000 nM, (g) 2500 nM, (h) 5×10³ nM, and (i) 75×102 nM of PbCl2 with N-rGO@TiO2 nanocomposite.
Sensing of Hg2+
The N-rGO@TiO2 nanocomposite was tested for the spectroscopic determination of Hg2+. Because of the formation of an intense UV absorption band of N-rGO@TiO2 nanocomposite, it is much straightforward to monitor changes in the UV absorption band during the determination of Hg2+ (Figure 8). A significant decrease in the absorption peak with a red-shift on the UV band of the N-rGO@TiO2 nanocomposite was observed upon increasing the concentration of Hg2+ ions. Thus, the Hg2+ with a concentration of 15 μM was taken as a limit of detection for N-rGO@TiO2 nanocomposite (r2=0.022x+0.09). After the addition of 1000 μM concentration of Hg2+ into the nanocomposite, the UV absorption peak was completely disappeared. The spiked sample analysis confirmed the presence of 75 μM Hg2+ ions in the wastewater. The red-shift and significant decrease in the absorption peak intensity were caused due to the redox interaction between the Hg2+ ions and the N-rGO@TiO2 nanocomposite. The red-shift in the UV absorption band can be attributed to the adsorption of Hg2+ onto the N-rGO@TiO2 nanocomposite surface and thereby formed a combination. Finally, the addition of Hg2+, N-rGO@TiO2 nanocomposite was turned colorless.
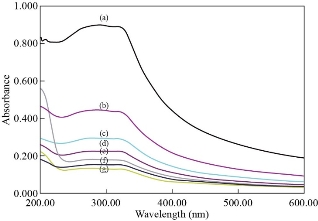
Fig. 8 UV absorption spectral changes observed for N-rGO@TiO2 nanocomposite upon the addition of Hg2+ions: (a) 0 μM, (b) 15 μM, (c) 50 μM, (d) 75 μM, (e) 100 μM, (f) 250 μM, and (g) 500 μM of Hg2+ions with N-rGO@TiO2 nanocomposite.
Sensing of Cr (VI)
The detection of Cr(VI) ion by the N-rGO@TiO2 nanocomposite was performed by the UV spectroscopically. Figure 9 shows the UV absorption spectra of N-rGO@TiO2 nanocomposite get increased with a decreased the concentration of Cr(VI) ions. It means the intensity of the UV absorption peak of the N-rGO@TiO2 nanocomposite is inversely proportional to the concentration of Cr(VI). Finally, the peak that disappeared was at the highest concentration of Cr(VI) ions. The change in the UV spectra of N-rGO@TiO2 nanocomposite occurs at 25 nM concentration of Cr (VI) ions. It exhibited a prominent peak at 283 nm (r2=0.0014x+0.05). The intensity of this peak was significantly decreased with increasing concentration of Cr (VI). The sudden changes of the peak at 25 nM concentration of Cr (VI) were considered as a limit of detection. After the addition of 1×10⁴ nM concentration of Cr (VI) ions into the N-rGO@TiO2 nanocomposite solution, the characteristic UV absorption peak was completely disappeared. The spiked sample analysis showed the 50 nM concentration of Cr (VI) was present in the wastewater. Overall, due to the strong adsorption of Cr (VI) on the N-rGO@TiO2 nanocomposite, it provides excellent sensing ability. Finally, the addition of Cr(VI) ion in the solution of N-rGO@TiO2 nanocomposite was turned colorless, which can be determined visually and can be confirmed by UV spectroscopy. As per the literature, the addition of TiO2 nanoparticles in graphene-based materials enhances the catalytic activity of nanoparticles. It may due to the high surface area and electron mobility of graphene. Moreover, it showed a high affinity towards the interest analyte. In addition, it provides a higher charge separation as well as higher charge transport potential. The main sensing mechanism of this nanocomposite is still unknown, but several possible mechanisms have been reported by previously published literature. In brief, the addition of rGO helps to the adsorption of heavy metals on the surface of nanocomposites via strong electrostatic interaction plus π−π stacking. Concisely, the graphene-based nanocomposite containing π domains is the major part of the driving force to the sensing of heavy metal ions. Furthermore, the synthesized nanocomposites were in 3D form. Owing to the 3D structure, it offers a high surface area and a more porous nature as compared to the 2 D materials. It may provide the higher binding sites for sensing of heavy metals [63]. Notable, the N contains the same atomic radius as graphene containing carbon. Due to the same atomic radius of ‘N’, it can be easily doped into carbon grid nanocomposites. Accordingly, the efficient doping of ‘N’ into nanocomposites also helps to improve the sensing ability and that resulted in the lowest detection limit for heavy metal ions. Also, it improves the stability and magnetic properties of graphene nanocomposites [64]. In addition to that, the N doped graphene nanocomposites provide a higher surface area and subsequently provide more site for adsorption of heavy metal ions on the surface of nanocomposites. The combination of TiO2 and graphene followed by ‘N’ doping resulted in high electron mobility of the catalyst plus a larger specific surface area. This also helps to absorb and degrade the analyte [59]. Overall, the synthesized 3D, porous N-rGO@TiO2 nanocomposites demonstrate good sensing ability and excellent performance, which are much essential in the protection of the ecosystem.
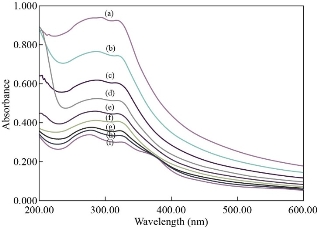
Fig. 9 Spectroscopic sensing of Cr(VI) using N-rGO@TiO2 nanocomposites: (a) 0 nM, (b) 25 nM, (c) spiked sample (50 nM), (d) 100 nM, (e) 250 nM, (f) 500 nM, (g) 2500 nM, (h) 5×10³ nM, and (i) 75×102 nM of K2Cr2O7 solution with N-rGO@TiO2 nanocomposite.
Conclusions
In summary, the green synthesis of N-rGO@TiO2 nanocomposite is a single-step, facile, economical and less time-consuming method. The Gossypium hirsutum seeds are a good source of ‘N’ containing amino acid and proteins, which provide the N doping. They also reduce the Go and stabilize the nanocomposites. Concisely, the reported method simultaneously resulted in the eco-friendly synthesis of the N-rGO@TiO2 nanocomposite. This nanocomposite accomplished an exceptional probe for the detection of Pb2+, Hg2+, and Cr (VI) with 50 nM, 15 µM and 25 nM lower detection limits, respectively. In addition, the analysis of heavy metals (Pb2+, Hg2+, Cr (VI)) in spiked samples using synthesized N-rGO@TiO2 nanocomposites provided an excellent result. Besides, the application of a simple spectroscopic method with eco-friendly nanocomposites can provide an alternative cost-effective tool to conventional and expensive methods for heavy metal detection in water. Overall, the findings of these investigations confirmed that the N-rGO@TiO2 nanocomposite exhibited better Pb2+, Hg2+ and Cr (VI) sensing ability in water through the spectroscopic method. In the future, these nanocomposites could provide better environmental remediation.
Acknowledgments
The authors are thankful to Kavayitri Bahinabai Chaudhari North Maharashtra University (KBCNMU), Jalgaon for providing funding through the Vice-Chancellor Research Motivation Scheme (VCRMS, NMU/HA/VCRMS/Budget-2016-17/Pharmacy-10/84/2017).
Conflict of Interests
The authors declare that no competing interest exists.
References
Copyright© Pravin Onkar Patil, Sopan Namdev Nangare, Pratiksha Pramod Patil, Ashwini Ghanashyam Patil, Dilip Ramsing Patil, Rahul Shankar Tade, Arun Madhukar Patil, Prashant Krishnarao Deshmukh, and Sanjay Baburao Bari. This is an open-access article distributed under the terms of the Creative Commons Attribution License, which permits unrestricted use, distribution, and reproduction in any medium, provided the original author and source are credited.

|
Nano Biomedicine and Engineering. Copyright © Shanghai Jiao Tong University Press |
 |