Research Article
Synthesis of Hydroxyapatite Nanostructures Using Chemical Method
Marwa Abdul Muhsien Hassan *, Asmaa Hadi Mohammed *, Wahab Basim Mahdi*
Department of Physics, College of Science, Mustansiriyah University, Baghdad, Iraq.
* Corresponding authors. E-mail: marwamedicalphysics@uomustansiriyah.edu.iq; marwamedicalphysics@gmail.com
Received: Jan. 12, 2021 Accepted: May 27, 2021; Published: Sep. 8, 2021
Citation: Marwa Abdul Muhsien Hassan, Asmaa Hadi Mohammed, and Wahab Basim Mahdi, Synthesis of Hydroxyapatite Nanostructures using Chemical Method. Nano Biomed. Eng., 2021, 13(3): 279-310.
DOI: 10.5101/nbe.v13i3.p279-310.
Abstract
In this research, hydroxyapatite was prepared from natural and industrial sources using a simple chemical method. The fish (scales and bones), snail shells, bovine bones, horse bones, egg shells, cuttlefish bones and crab shells are composed by crystals of calcium carbonate (94%), organic matter (4%), calcium phosphate (1%) and magnesium carbonate (1%). EDX data for derived HAp from natural sources at 600°C, 800°C, 900°C and 1100 °C, respectively. Based on the EDX signatures, the Ca/P weight ratio for derived HAp was calculated and was found to be 1.67 at 600°C, 800°C, 900°C and 1100 °C, respectively. In the present work, it was found that XRD 2θ positions of the (bones, scales and shells) samples calcined at 600 °C and 1100 °C shifted by total error of 0.056 and 0.031, respectively, thus indicating that the HAp lattice has contracted due to loss of OH radicals. The peak at 1026-1049 cm-1 (ν3) was attributed to triply degenerate asymmetric ν3(PO) stretching. The tetrahedral ![]() internal mode (ν1) observed at 960 cm-1 represents the symmetric stretching of the P-O bond. The position of this peak represents the degree of crystallinity of the material and confirmed that the prepared HAp had highly crystallized nature.
internal mode (ν1) observed at 960 cm-1 represents the symmetric stretching of the P-O bond. The position of this peak represents the degree of crystallinity of the material and confirmed that the prepared HAp had highly crystallized nature.
Keywords: Hydroxyapatite, SEM, EDX, Chemical method
Introduction
Only a few of known materials satisfy the requirements of implantation in the body. These biomaterials belong into five major classes of materials: metals, ceramics, polymers, composites and natural materials [1-6]. Wide diversity of these materials have been used in medicine via researches done in the last 50 years, by which, controlling the composition, purity, physical properties of the materials and synthesizing new materials with new and special properties which were tailored according to the needs of medical applications such as: woven polymer fibers in vascular grafts, bundles of cellulose acetate fibers in artificial kidney dialyzers and titanium alloys in hip replacements [7-10]. The common property of all the biomaterials is biocompatibility or non toxicity which is communicated and recognized by the body as a potentially non harmful foreign substance [11-15]. Body can react instantly to a foreign material by cells in the body fluid and start the inflammation reaction accompanied and after wound healing process [16-18]. Once an implant takes place in the body, an injury response is initiated by the tissue that results in inflammation as a reaction to local injury. The implant, at injury site leads to immediate development of the provisional matrix which consists of fibrin and inflammatory products released by the activated platelets, inflammatory cells and endothelial cells [19-21]. Not all biocompatible materials are immobile in the body but the highly bioactive ones incorporate to the actions of body like providing a host matrix for tissue growth or being slowly replaced by the growing tissue. Biocompatible materials are classified as bioinert, resorb able and bioactive according to tissue response. Bioinert materials induce formation of a fibrous tissue of variable thickness; interfacial bond forms on bioactive materials and resorb able materials are replaced by the surrounding tissue. Materials capable of evading attack (by the body's immune system) and stimulating tissue growth are potentially far more effective and less costly. Mechanical similarity of the biomaterial to the host or replaced tissue is another important property especially in hard tissue replacements the biomaterial is required to support or share a portion of load. Compressive strength, fracture toughness and hardness of biomaterials are important as well in these cases. hydroxyapatite (HAp) has been the focus of biomaterials research as a highly biocompatible ceramic with a relatively simple processing. Its use in orthopedic surgery and as bone graft substitute has dominated any other material in quantity. Biomaterials with improved mechanical properties have been synthesized by the incorporation of hydroxyapatite in composites as a ceramic matrix. HAp has also been used to increase the biocompatibility of mechanically strong materials either as coating or reinforcement particles or fibers. The versatility of HAp as part of bio composites enables materials engineers to combine materials with various degrees of biocompatibility to produce satisfactory biomaterials for a certain application in the body [22, 23].
Experimental
Natural hydroxyapatite is usually extracted from biological sources or wastes such as mammalian bone (e.g. bovine, cuttlefish, and horse), and marine or aquatic sources (e.g. fish bone and fish scale), shell sources (e.g., crab shell, eggshell, and snailshell).
Preparation hydroxyapatite from fish bones, fish scales, and snail shells
The fish (bones and scales), egg and snail shells as a calcium source was washed carefully with hot deionized water for three days. In this method, the alkaline solution usually NaOH is used to remove the proteins, lipids, oils and other organic matter from the bone. The 1.0% NaOH solution hydrolyzes the organic component in the (bones, scales and shells) and the remaining calcium phosphate is rinsed and separated using filtration. The product was dried in an oven at 170 ºC for 48 hour. Finelly, raw materials obtained were ground with a mortar and pestle, and then sieved at 250 μm particle size. Moreover, 2.5 gm of treated bones, scales and shells were placed in an open silica crucible and heated in an electric furnace under ambient conditions, at different temperatures ranging from 600 °C to 1100 °C with 4-5 hour holding time to obtained HAp powder.
Preparation hydroxyapatite from (bovine bones, horse bones and cuttlefish bones)
Among mammalian sources, the extractions of HAp from (Bovine bones, horse bones, and cuttlefish bones). In addition, mammalian bones contain higher source of ions and trace elements. The cortical part of the femoral bone is usually used because they are morphologically and structurally similar to human bone. Generally, most literature have reported that pretreatment of the bone is usually done before proceeding with the extraction method. The pretreatment involves washing and removing the dirt, fats, protein, and other components such as bone marrows and soft tissues. Some literature reported the usage of boiling water to remove organic components from the bone by boiling for times of 8 hour or more. A combination of boiling and washing with solvents such as acetone and chloroform have been employed for the pretreatment of bone. Another pretreatment method that has been widely used is washing the bone alternatively with surfactant and alkali solutions to remove the soft tissues and decellularise it. The bone was also cut into smaller pieces before or after removing the organic constituents. Most majority of literature reported that the bone was cut first into smaller pieces before boiling or treated with the solvent to remove the unwanted components such as bone marrow located inside the bone [24]. The raw materials were calcinated in an air atmosphere at 600, 900 and 1000°C using a tube furnace as shown in Fig. 1(a)-(c). The thermal treatment through the calcination had two parts: in the first 30 min to completely remove the organic matter and kill the pathogens which may be present, whereas in the second part the bovine bones, horse bones and cuttlefish bones transformation into calcium-oxide was obtained for 4 hour. Bones were crushed and milled in a ball milling, which equipped with alumina balls and bowls. To synthesize calcium phosphate powders, the crushed bones were reacted by an exothermic reaction with phosphoric acid (0.5 M H3PO4 solution (as a sourse of phosphorous)) for one hour under continuous stirring using a magnetic stirrer. HAp crystals were put in a tube furnace under ambient conditions at temperatures 1100°C for 4 hours to produce HAp fine powder.
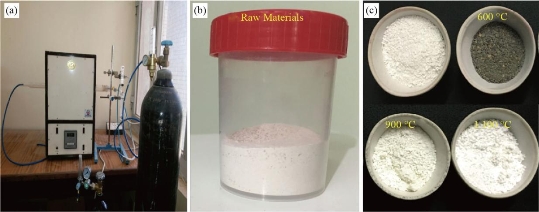
Fig. 1 (a) Calcination furnace used in this work; (b) Raw materials and (c) raw materials were calcinated in an air atmosphere at 600, 900 and 1100 °C using the tube furnace.
Preparation hydroxyapatite from crab shells
First step, shell of crab shells as a calcium source were cleaned from dirt, soiles and sticking flesh, then under sun temperature dried. The second step, dried shell was then ground to a fine powder and analyzed using XRD to determine CaCO3 phase contained therein. The third step included, shell powder was calcined at different temeratures 400, 600 and 900 °C for 4 hours to produce CaO compound. Moreover, CaO compound was converted to Ca(OH)2 at temerature 1000 °C for 4 hours. XRD analysis was using for ensuring the formation of Ca(OH)2 in this study. Finally, Ca(OH)2 suspension from shell of crab shells were drop wisely added with 0.6 M H3PO4 solution (as a sourse of phosphorous) at 40±5°C temperature for 1:30 hour under continuous stirring using a magnetic stirrer. Then, the formed mixture was sonicated at sonication time 6 hours to obtain a uniform HAp nanoparticle size. Sonication resulting solution was decanted for one day (24 hours) at room temperature ~25 oC. The precipitate was centrifuged at 4500 rpm for 15 minutes and then rinsed with deionized water. Then, the precipitate was dried at 100°C for 3-4 hours. The dried precipitate was ground finely in a mortar, and put in a furnace at different temperatures 600, 900 and 1100°C for 4 hours to produce HAp nano powder while allowed to cool at room temperature ~25 oC. Hydroxyapatite obtained from shell of crab shells was tested and the best results were determined as shown in Fig. 2.

Fig. 2 Crystal structure and schematic illustration of stoichiometric hydroxyapatite (HAp). HAp contains both captions and anions in its structure and has high affinity for organic molecules. The blue, white, red and yellow spheres are Ca, P, O, and OH respectively.
Synthesis of hydroxyapatite (HAp) from commercial source
A solution of 0.6 M H3PO4 was added drop wise to a 1 M Ca(OH)2 aqueous solution under continuous stirring at room temperature (~25 oC). HAp crystals were synthesized by the co-precipitation method at final pH was to be found 11 by adding an ammonia solution. The resultant precipitate was stirring for 24 hour by using a magnetic stirrer. The white precipitate obtained was then collected by centrifugation at 4500 rpm for 15 minutes and washed repeatedly with deionized water. The product was dried in an oven at 80 ºC for 24 hour. The HAp crystals obtained were ground with a mortar and pestle and then sieved at 45 μm. Finally, the HAp crystals were calcined at different temperatures 600, 900 and 1100 ºC in a conventional tube furnace under an air atmosphere for 4 hour. The ion exchange process is carried out to replace calcium action by sodium and potassium ions. The ion exchange process is carried out by adding synthesized HAp nanoceramic powder in NaCl and KCl (0.1M) solutions and shaking them for 5 hour, at room temperature, to get saturation. This ion exchanged HAp is then filtered and dried at 100 ◦C. The pellets of pure and ion exchanged HAp, prepared using hydraulic press at 5 ton pressure, are used as the samples for further bioactivity [25].
Preparation of pure and doped hydroxyapatite
Calcium nitrate, orthophosphoric acid and 1% materials salts were dissolved separately in deionized water. Dissolved materials salts were added with the calcium nitrate solution. Finally, orthophosphoric acid was added to above solution. Ammonium hydroxide was added to fix the pH solution to 10-11. The solution was stirring using a magnetic stirrer for 24 hours. Hydroxyapatite was washed with deionized water, and then it was dried in a furnace at the temperature of 100 ℃. The powders were sintered at the temperature of 1100 ℃ for 4 hours.
Preparation of calcium hydroxyapatite (CaHAp)
Calcium acetate monohydrate (Ca(CH3COO)2·H2O was dissolved in distilled water and mixed under magnetic stirrer for 30 min at 65°C. Secondly, 1,2-ethandiol was added to this solution and stirred for 15 min. Next, ethylenediaminetetraacetic acid (EDTA; 99.0%) and triethanolamine (TEA; 99.0%) as complexing agents were slowly dripped into the solution. After 10 hour of stirring, phosphoric acid (H3PO4; 85.00%) was added to the above solution.
Hydroxyapatite pore modification using chitosan
Hydroxyapatite-Chitosan composite with a 20/80 (wt/wt) composition was prepared by using blending method. An aqueous Chitosan solution was prepared by dissolving 0.4 gm Chitosan powder in 1 wt% acetic acid solution. Then, 0.1 gm uncalcined HAp obtained from the first method was dispersed completely in the Chitosan solution under continuous stirring using a magnetic stirrer for 1 hour at room temperature ~25 oC. The pH of the obtained hydroxyapatite-Chitosan solution was adjusted to 11 by the addition of an ammonia solution. After stirring for 24 hour using a magnetic stirrer, the composite was centrifuged and washed repeatedly with deionized water. Finally, the composite obtained was calcined at different temperatures 600, 900 and 1100 ºC in a conventional tube furnace under an air atmosphere for 4 hours.
Bioactivity test
Bioactivity test was done by taking SBF (simulated body fluid). Simulated body fluids (SBF) prepared in accord with the chemical analysis of human body fluid, with ion concentrations nearly equal to those of the inorganic constituents of human blood plasma.
Preparation of SBF solution
SBF is known to be metastable buffer solutions and even a small, undesired variance in both of the preparation steps and the storage temperatures, may drastically affect the phase purity and high temperature stability of the produced HAp powders, as well as the kinetics of the precipitation processes. Merck-grade NaCl (99.5%), NaHCO3 (99.5%), KCl (99.0%), Na2HPO4 2H2O (99.5%), MgCl2 6H2O (99.0%), Na2SO4, (CH2OH)3CNH2 (99.5%), CaCl2H2O (99.0%) and HCl (37 vol%) were used in the preparation of the SBF of this study as shown in Table 1 [18]. SBF solutions were prepared by dissolving appropriate quantities of the above chemicals in deionized water. Reagents were added, one by one after each reagent was completely dissolved in 700 ml of water, in the order given in Table 2. A total of 40 ml of 1 M HCl solution was consumed for pH adjustments during the preparation of 1 Ltr. of SBF solutions. A 15 ml aliquot of this acid solution was added just before the addition of the sixth reagent, i.e. CaCl2 2H2O. Otherwise, the solution would display slight turbidity. The remaining part of the HCl solution was used during subsequent titration. Following the addition of the eighth reagent (tris (hydroxymethyl) aminomethane), the solution temperature was raised from ambient to 37 oC. This solution was then titrated with 1 M HCl to a pH of 7.4 at 37 oC. During the titration process, the solution was also continuously diluted with consecutive additions of de-ionized water to make the final volume equal to 1 Ltr. It was observed in this study that the prepared SBF solutions can be stored at 5 oC for a month without degradation [18].
Table 1 Chemical composition of SBF solutions
|
Order |
Reagent |
Amount (gpl) |
|
1 |
NaCl |
6.547 |
|
2 |
NaHCO3 |
2.268 |
|
3 |
KCl |
0.373 |
|
4 |
Na2HPO4 2H2O |
0.178 |
|
5 |
MgCl2 6H2O |
0.305 |
|
6 |
CaCl2H2O |
0.368 |
|
7 |
Na2SO4 |
0.071 |
|
8 |
(CH2OH)3CNH2 |
6.057 |
Table 2 Ion concentrations of SBF solutions and human plasma
|
Ion |
Kokubo et al. (mM) |
Present work (mM) |
Human plasma (mM) |
|
Na+ |
142.0 |
142.0 |
142.0 |
|
K+ |
5.0 |
5.0 |
5.0 |
|
Mg+ |
1.5 |
1.5 |
1.5 |
|
Ca+ |
2.5 |
2.5 |
2.5 |
|
Cl- |
147.8 |
125.0 |
103.0 |
|
HCO3- |
34.2 |
27.0 |
27.0 |
|
HPO4_ |
1.0 |
1.0 |
1.0 |
|
SO4_ |
0.5 |
0.5 |
0.5 |
In-vitro test with SBF solution
2.0 gm HAp powder was made into compressed spherical prills and then added in150 mL SBF solution. Soaking was conducted at predetermined times, which were 6 and 20 days [18]. SBF solution resulted from soaking was pipetted 20 mL and then filtered with Whatman filter paper No. 40.
Results and Discussions
Electron dispersive X-ray analysis for hydroxyapatite
An important aspect in the development of methods of synthesis of hydroxyapatite is the use of raw materials from unconventional sources. Here, it is reported the use of fish (scales and bones), snail shells, bovine bones, horse bones, egg shells, cuttlefish bones and crab shells as a calcium source for the synthesis of HAp. The fish (scales and bones), snail shells, bovine bones, horse bones, egg shells, cuttlefish bones and crab shells are composed by crystals of calcium carbonate (94%), organic matter (4%), calcium phosphate (1%) and magnesium carbonate (1%) as shown in Fig. 3 and listed in Table 3. It shows the spatial arrangement of crystals of calcium carbonate (CaCO3) and its size. It is also noted, in Fig. 4(a) and (b), and Table 4, that these crystals grow with a preferential crystal orientation in the direction corresponding to the c axis of the unit cell of CaCO3, perpendicular to the surface of the shell and bone; this is because the structure is more stable mechanically in that direction. After collecting and mechanically cleaned fish (scales and bones), snail shells, bovine bones, horse bones, egg shells, cuttlefish bones and crab shells, they were subjected to a heat treatment in two stages: the first consisted of heating at a rate of 5 °C per minute to reach a temperature of 400-600 °C, maintained for 4 hours (Fig. 4(a) and (b)). At this stage eliminates the organic phase that could be present in the sample. The second stage consisted of heating the samples to reach 900 °C at a rate of 0.5 °C per minute and maintaining this temperature for 4 hours as shown in Fig. 4(c) and Table 4. At this temperature the calcium carbonate transform into calcium oxide through the freeing carbon dioxide according to the following equation:
![]() (1)
(1)
This was confirmed by X–ray Diffraction analysis (XRD). The concentration of reagents was calculated taking into account that the Ca/P in the stoichiometric hydroxyapatite is 1.67, so the CaO was transformed into HAp by reaction with tricalcium phosphate (TCP, Ca3(PO4)2). The reaction was carried out at 1100 oC for 3 hours in a moist atmosphere using different heating rates to have control of the species obtained. In the first place, when the calcium oxide is mixed with water, a reaction between CaO and H2O takes place to obtain Ca(OH)2 as shown in Fig. 5 and Table 5. Therefore, this phase is present as initial reactant, as well as during reaction and then hydroxyapatite can be obtained according to the following equation:
![]() (2)
(2)
At end of process, HAp is obtained and small amounts of monetite (CaHPO4) and unreacted CaO. This was confirmed by performing X-ray Diffraction analysis (XRD).The relative amount of HAp obtained can be controlled depending on the heating rate during heat treatment and the presence of monetite as an impurity can be explained by the simultaneous occurrence of the following reactions:
![]() (3)
(3)
![]() (4)
(4)
The values of Ca/P ratio during synthesis of hydroxyapatite from fish (scales and bones), snail shells, bovine bones, horse bones, egg shells, cuttlefish bones, crab shells and phosphoric acid were 1.70 and 1.64 for two different mixing ratios of the calcined to phosphoric acid. Fig. 6(a)-(f) show the natural sorces for hydroxyapatite. EDXS is an analytical technique used for elemental analysis or chemical composition of a sample. Fig. 7 represent the EDXS data for derived HAp at 1100 °C from (fish bones, fish scales, snail shells, bovine bones, horse bones, egg shells, cuttlefish bones and crab shells), respectively. Based on the EDXS signatures, the Ca/P weight ratio for derived HAp was calculated and was found to be 1.67 at 1100 °C, respectively; the resultant values are consistent with previous values reported elsewhere. As the Ca/P weight ratio of the derived HAp at 1100 °C did not show any considerable difference, it can be inferred that Ca/P weight ratio is independent of calcination temperature. Bone is specialized tissue that characterizes vertebrates. Bones and teeth are living organisms made up of minerals and tissues, the latter consist of cells, fatty substances, natural polymers (such as polysaccharides, collagen and polyphosphates) and other substances. While the properties of bone tissue and the proportions of the substances that form them vary according to different parts of the skeleton, we can consider that contain about two thirds of his weight of inorganic material and a third of organic material in average. So, bone tissue is composed of a mineral phase that occupies about 69% of its total weight, about 9% water and about 22% of an organic matrix, which consists, in turn, mainly of collagen (90-96%). The mineral phase is composed mainly of microscopic crystals of calcium phosphates, in which the hydroxyapatite (HAp), whose chemical formula is Ca10(PO4)6(OH)2, is the most important. Other mineral phases that are present in bone are dicalcium phosphate (Ca2P2O7), dibasic calcium phosphate (DCP, CaHPO4), tricalcium phosphate (TCP, Ca3(PO4)2) and some amorphous phases of calcium phosphate. There are also other ions such as citrate (![]() ), carbonate (
), carbonate (![]() ), fluoride (F-) and hydroxyl ions (OH-), which can lead to subtle differences in bone microstructure. Finally, there are also some impurities such as magnesium and sodium, traces of chlorine and iron. Only both the HAp as well as the DCP are the calcium phosphate phases that are chemically stable at the temperature and pH of the human body (37 ° C and about 7, respectively). From a biological standpoint, the bones are defined as connective tissue and their function as a structural component of the human body are well known, serves to support, protect delicate parts and organs and provides a connection between the muscles, allowing movement. From the standpoint of Materials Science, bone tissue is classified as a "composite", in which the mineral phase supports almost all the mechanical loads and the organic phase (collagen) serves as a binding material, also absorbs impacts, providing flexibility to the bone. In terms of the microstructure of the mineral phase, the bone can be classified as cancellous (or spongy) or as cortical, resulting in different mechanical properties. The process of mineralization of bone tissue is very complex and remains largely unknown. The main constituents of the inorganic salts that make bone tissue are present, in the form of aqueous solutions, in the physiological fluid (blood plasma or extracellular fluid) coming from the blood vessels vascularized bone tissue. Under a chemical analysis, the bone has large amounts of complex groups of cations and anions, such as Ca2+,
), fluoride (F-) and hydroxyl ions (OH-), which can lead to subtle differences in bone microstructure. Finally, there are also some impurities such as magnesium and sodium, traces of chlorine and iron. Only both the HAp as well as the DCP are the calcium phosphate phases that are chemically stable at the temperature and pH of the human body (37 ° C and about 7, respectively). From a biological standpoint, the bones are defined as connective tissue and their function as a structural component of the human body are well known, serves to support, protect delicate parts and organs and provides a connection between the muscles, allowing movement. From the standpoint of Materials Science, bone tissue is classified as a "composite", in which the mineral phase supports almost all the mechanical loads and the organic phase (collagen) serves as a binding material, also absorbs impacts, providing flexibility to the bone. In terms of the microstructure of the mineral phase, the bone can be classified as cancellous (or spongy) or as cortical, resulting in different mechanical properties. The process of mineralization of bone tissue is very complex and remains largely unknown. The main constituents of the inorganic salts that make bone tissue are present, in the form of aqueous solutions, in the physiological fluid (blood plasma or extracellular fluid) coming from the blood vessels vascularized bone tissue. Under a chemical analysis, the bone has large amounts of complex groups of cations and anions, such as Ca2+, ![]() and
and ![]() ; other ions present in lesser amounts are Mg2+, Fe2+, F- and Cl-. Due at the cellular exchange, are also found small traces of Na+ and K+, ascorbic acid, citric acid and polysaccharides, as well as some heavy atoms, such as Ba2+, Sr2+ and Pb2+. The phosphorus and calcium ions promote the formation of salts, primarily amorphous hydroxyapatite and calcium triphosphate, which are dispersed within the organic phase, while once crystallized; the inorganic phase is practically hydroxyapatite, which provides the mechanical features of the bones previously mentioned. Because of this, it is obvious the study of ceramics as potential bone substitutes and in particular calcium phosphates such as hydroxyapatite. Bon composition (%) of adult’s animal as given in Table 6. EDXS is an analytical technique used for elemental analysis or chemical composition of a sample. Fig. 7(a)-(g) and Table 7 represent the EDX data for derived HAp from natural sources at 1100°C, respectively. Based on the EDX signatures, the Ca/P weight ratio for derived HAp was calculated and was found to be 1.67 at 1100 °C, respectively; the resultant values are consistent with previous values reported elsewhere. As the Ca/P weight ratio of the derived HAp at different temperatures did not show any considerable difference, it can be inferred that Ca/P weight ratio is independent of calcination temperature. EDXS analysis gives qualitative as well as quantitative status of elements that may be involved in formation of nanostructures. The Energy-dispersive X-ray spectroscopy (EDXS) result indicated that the as synthesized HAp nanostructures were composed of Ca, P and O only. No other peaks related to any impurity are detected in the energy dispersive X-ray microanalysis (EDXMA) spectrum, up to the detection limit of energy dispersive X-ray analysis (EDXA) instrument and thus, again confirms that the synthesized products are pure HAp made of Ca, P and O. Semiquantitative analysis indicates that the Ca/P molar ratio is about 1.67 and it is closer to the theoretical value of 1.67, confirming that the nanoparticles are hydroxyapatite treated at 800, 900 and 1100°C are compared in Fig. 8(a)-(c). The peak corresponding to C comes from the FESEM substrate. The results of the FESEM-EDXS analysis (Fig. 9(a)-(k)) showed that the Ca/P ratio of nano pure and doped HAp investigated in this study varies between 1.46 and 2.01 with an average of 1.67. The essential difference between synthetic and natural hydroxyapatite is that the latter showed a higher Ca/P ratio than the synthetic material, while the former was closer to the stoichiometric hydroxyapatite. It should be noted that there is a technical problem with the semi-quantitative analysis of Ca/P ratio of hydroxyapatite by the use of SEM-EDX. In other words, during the analysis at a fixed current density and increasing irradiation time, the X-ray intensity of phosphorus decreases more rapidly than that of calcium leading to an increase of the Ca/P ratio at a high electron irradiation dose. Thus, in this study, the accelerating voltage was set at 15 kV and the analysis was performed at a low irradiation time to overcome the above mentioned problem. The Energy-dispersive X-ray spectroscopy (EDXS) result indicated that the as synthesized CaHAp nanostructures were composed of Ca, P and O only treated at 800, 900 and 1100°C (see Fig. 10(a)-(c)).
; other ions present in lesser amounts are Mg2+, Fe2+, F- and Cl-. Due at the cellular exchange, are also found small traces of Na+ and K+, ascorbic acid, citric acid and polysaccharides, as well as some heavy atoms, such as Ba2+, Sr2+ and Pb2+. The phosphorus and calcium ions promote the formation of salts, primarily amorphous hydroxyapatite and calcium triphosphate, which are dispersed within the organic phase, while once crystallized; the inorganic phase is practically hydroxyapatite, which provides the mechanical features of the bones previously mentioned. Because of this, it is obvious the study of ceramics as potential bone substitutes and in particular calcium phosphates such as hydroxyapatite. Bon composition (%) of adult’s animal as given in Table 6. EDXS is an analytical technique used for elemental analysis or chemical composition of a sample. Fig. 7(a)-(g) and Table 7 represent the EDX data for derived HAp from natural sources at 1100°C, respectively. Based on the EDX signatures, the Ca/P weight ratio for derived HAp was calculated and was found to be 1.67 at 1100 °C, respectively; the resultant values are consistent with previous values reported elsewhere. As the Ca/P weight ratio of the derived HAp at different temperatures did not show any considerable difference, it can be inferred that Ca/P weight ratio is independent of calcination temperature. EDXS analysis gives qualitative as well as quantitative status of elements that may be involved in formation of nanostructures. The Energy-dispersive X-ray spectroscopy (EDXS) result indicated that the as synthesized HAp nanostructures were composed of Ca, P and O only. No other peaks related to any impurity are detected in the energy dispersive X-ray microanalysis (EDXMA) spectrum, up to the detection limit of energy dispersive X-ray analysis (EDXA) instrument and thus, again confirms that the synthesized products are pure HAp made of Ca, P and O. Semiquantitative analysis indicates that the Ca/P molar ratio is about 1.67 and it is closer to the theoretical value of 1.67, confirming that the nanoparticles are hydroxyapatite treated at 800, 900 and 1100°C are compared in Fig. 8(a)-(c). The peak corresponding to C comes from the FESEM substrate. The results of the FESEM-EDXS analysis (Fig. 9(a)-(k)) showed that the Ca/P ratio of nano pure and doped HAp investigated in this study varies between 1.46 and 2.01 with an average of 1.67. The essential difference between synthetic and natural hydroxyapatite is that the latter showed a higher Ca/P ratio than the synthetic material, while the former was closer to the stoichiometric hydroxyapatite. It should be noted that there is a technical problem with the semi-quantitative analysis of Ca/P ratio of hydroxyapatite by the use of SEM-EDX. In other words, during the analysis at a fixed current density and increasing irradiation time, the X-ray intensity of phosphorus decreases more rapidly than that of calcium leading to an increase of the Ca/P ratio at a high electron irradiation dose. Thus, in this study, the accelerating voltage was set at 15 kV and the analysis was performed at a low irradiation time to overcome the above mentioned problem. The Energy-dispersive X-ray spectroscopy (EDXS) result indicated that the as synthesized CaHAp nanostructures were composed of Ca, P and O only treated at 800, 900 and 1100°C (see Fig. 10(a)-(c)).
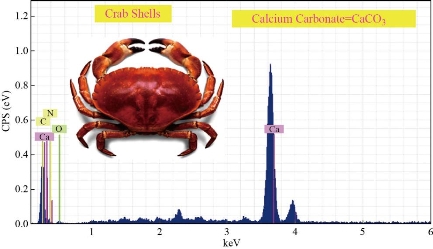
Fig. 3 EDXS of crab shells as a calcium source for the synthesis of HAp before calcination.
Table 3 EDXS of crab shells as a calcium source for the synthesis of HAp before calcination
|
Element |
AN |
Series |
wt.% |
Norm. wt.% |
Norm. at.% |
Error in wt.% (1 Sigma) |
|
Calcium |
20 |
L-series |
64.62868 |
53.00955 |
19.08909 |
2.289584 |
|
Calcium |
20 |
K-series |
36.30267 |
29.77607 |
32.57515 |
1.344174 |
|
Carbon |
6 |
K-series |
13.84385 |
11.35496 |
41.45068 |
3.220634 |
|
Oxygen |
8 |
K-series |
5.224973 |
4.285612 |
1.958566 |
0.401675 |
|
Nitrogen |
7 |
K-series |
1.918766 |
1.573805 |
4.926518 |
1.445954 |
|
-- |
-- |
Sum: |
121.9189 |
100 |
100 |
-- |
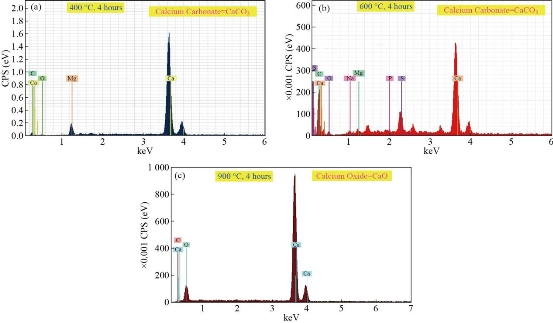
Fig. 4 EDXS of crab shells as a calcium source for the synthesis of HAp after calcination at (a) 400 oC, (b) 600 oC, and (c) 900 oC for 4 hours.
Table 4 EDXS of crab shells as a calcium source for the synthesis of HAp after calcination at 400 oC and 600 oC for 4 hours
|
Element |
AN |
Series |
wt.% |
Norm. wt.% |
Norm. at.% |
Error in wt.% (1 Sigma) |
|
Calsination temperature = 400 oC |
||||||
|
Calcium |
20 |
L-series |
66.325212 |
55.20013 |
20.23701 |
2.162711 |
|
Calcium |
20 |
K-series |
38.552261 |
30.04412 |
34.21011 |
1.188425 |
|
Carbon |
6 |
K-series |
11.631732 |
8.044320 |
40.59081 |
3.172282 |
|
Oxygen |
8 |
K-series |
4.114717 |
5.361382 |
1.742008 |
0.397334 |
|
Nitrogen |
7 |
K-series |
1.855213 |
1.350052 |
3.220062 |
1.502216 |
|
-- |
-- |
Sum: |
122.47914 |
100 |
100 |
-- |
|
Calsination temperature = 600 oC |
||||||
|
Calcium |
20 |
L-series |
64.728363 |
56.32714 |
21.07281 |
2.164272 |
|
Calcium |
20 |
K-series |
35.448123 |
31.20901 |
33.01982 |
1.234174 |
|
Carbon |
6 |
K-series |
14.281042 |
4.090901 |
39.91838 |
4.073952 |
|
Oxygen |
8 |
K-series |
6.829173 |
7.365701 |
2.589997 |
0.557745 |
|
Nitrogen |
7 |
K-series |
1.289489 |
1.007251 |
3.398997 |
1.693273 |
|
-- |
-- |
Sum: |
|
100 |
100 |
-- |
|
Calsination temperature = 900 oC |
||||||
|
Calcium |
20 |
L-series |
100.0399 |
57.17473 |
26.56396 |
3.257375 |
|
Calcium |
20 |
K-series |
54.84962 |
31.34762 |
44.24673 |
1.841968 |
|
Magnesium |
12 |
K-series |
18.26475 |
10.43866 |
24.29584 |
1.387355 |
|
Carbon |
6 |
K-series |
1.817951 |
1.038994 |
4.893466 |
0.805625 |
|
-- |
-- |
Sum: |
174.9722 |
100 |
100 |
-- |
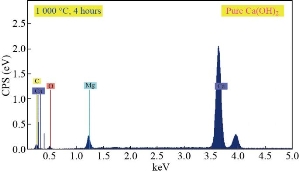
Fig. 5 Reaction between CaO and H2O takes place to obtain Ca(OH)2
Table 5 Reaction between CaO and H2O takes place to obtain Ca(OH)2
|
Element |
AN |
Series |
[wt.%] |
[norm. wt.%] |
[norm. at.%] |
Error in wt.% (1 Sigma) |
|
Calcium |
20 |
K-series |
47.80265 |
28.99275 |
40.43999 |
1.839388 |
|
Calcium |
20 |
L-series |
99.36476 |
60.26565 |
27.66964 |
3.539519 |
|
Magnesium |
12 |
K-series |
11.74352 |
7.122554 |
16.38203 |
1.189595 |
|
Carbon |
6 |
K-series |
4.069053 |
2.467918 |
11.48628 |
2.346173 |
|
Oxygen |
8 |
K-series |
1.89796 |
1.15113 |
4.022059 |
1.640758 |
|
-- |
-- |
Sum: |
164.8779 |
100 |
100 |
-- |
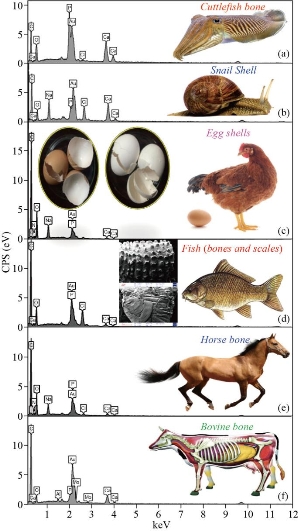
Fig. 6 EDXS of (a) cuttlefish bones, (b) snail shells, (c) egg shells, (d) fish (bones and scales), (e) horse bones and (f) bovine bones as a calcium source for the synthesis of HAp before calcination.

Table 6 Bon composition (%) of adult’s animal.
|
Elements |
Concentration (wt. %) |
|
Calcium |
39 |
|
18.5 |
|
|
Sodium |
0.85 |
|
Magnesium |
0.75 |
|
Potassium |
0.05 |
|
Carbonates |
7.5 |
|
Fluorine |
0.04 |
|
Chlorine |
0.16 |
|
Pyrophosphates |
0.08 |
|
Other elements |
0.06 |
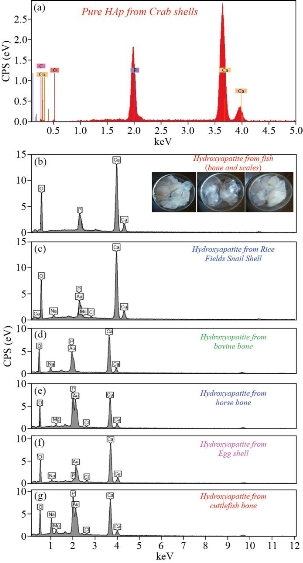
Fig. 7 EDXS of HAp from natural sources: (a) Crab shells, (b) fish (bones and scales), (c) snail shells, (d) bovine bones, (e) horse bones, (f) egg shells, and (g) cuttlefish bones.
Table 7 EDXS of HAp from crab shells as a natural source
|
Element |
AN |
Series |
wt.% |
Norm. wt.% |
Norm. at.% |
Error in wt.% (1 Sigma) |
|
Calcium |
20 |
K-series |
44.32627 |
24.8092 |
36.55001 |
1.521597 |
|
Calcium |
20 |
L-series |
92.91767 |
52.00557 |
25.21952 |
3.014168 |
|
Phosphorus |
15 |
K-series |
21.03439 |
11.77284 |
22.44235 |
0.984346 |
|
Carbon |
6 |
K-series |
2.308689 |
1.292162 |
6.352121 |
1.545851 |
|
39 |
L-series |
16.47886 |
9.223137 |
6.125323 |
0.89123 |
|
|
Oxygen |
8 |
K-series |
1.602831 |
0.897097 |
3.310674 |
1.084849 |
|
-- |
-- |
Sum: |
178.6687 |
100 |
100 |
-- |
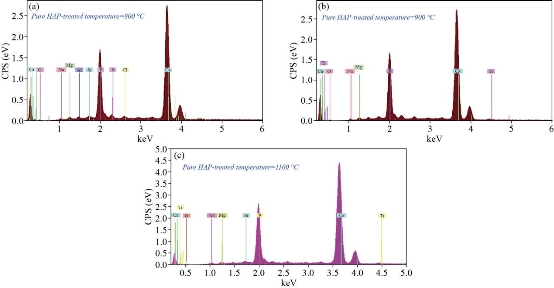
Fig. 8 EDXS of pure hydroxyapatite at treated temperature (a) 800 °C, (b) 900 °C, and (c) 1100 °C.
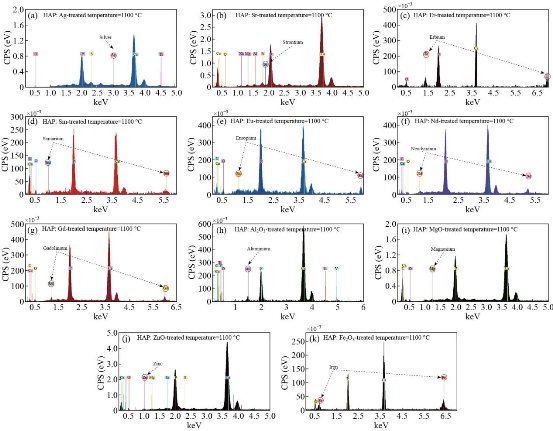
Fig. 9 EDXS of doped hydroxyapatite at treated temperature1100 °C: (a) HAP : Ag, (b) HAP : Sr, (c) HAP : Er, (d) HAP : Sm, (e) HAP : Eu, (f) HAP : Nd, (g) HAP : Gd, (h) HAP : Al2O3, (i) HAP : MgO, (j) HAP : ZnO, and (k) HAP : Fe2O3.
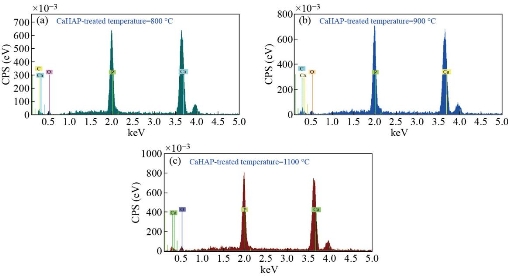
Fig. 10 EDXS of CaHAP at treated temperature: (a) 800 °C, (b) 900 °C and (c) 1100 °C.
X-ray diffraction analysis of hydroxyapatite
The phase and purity of derived HAp crystals (prepared from natural and artificial sources) were confirmed with XRD analysis. Fig. 11 shows the XRD pattern of raw fish (bone and scales), snail shells, bovine bones, horse bones, egg shells, cuttlefish bones, crab shells and treated (bones, scales and shells) at different treated temperatures. The mineral phase present in the as-collected fish (bones and scales), snail shells, bovine bones, horse bones, egg shells, cuttlefish bones and crab shells were identified as calcite; no other crystalline species was detected. As shown in Fig. 11, the X-ray reflections correspond to the (JCPD-card number) files for calcite (5-0586). The solid material obtained after the thermal processing at 500oC-1100 oC has a high porous appearance, white color and fragile consistence. The corresponding X-ray diffraction pattern (Fig. 12(a)-(e)) shows reflections corresponding to (JCPD-card number (37-1497)) files for CaO; again no other species was found in this figure. The observed change in the weight corresponds to the loss of gaseous CO2. These results can be explained as an incomplete transformation of calcite, due to a temperature not high enough or else to the annealing time which is too short. The XRD patterns of the as-prepared sample (artificial Ca(OH)2) are exhibited in Fig. 13. Main diffraction peaks are in good agreement with the JCPDS card No. (87-0674) of a typical hexagonal-phase Ca(OH)2 crystal (a = b = 3.589 °A; c = 4.911 °A), which only differ in the stronger intensity of (101) diffraction peak than that of (001), indicating that Ca(OH)2 particles probably prefer to grow along the c-axis. Meanwhile, the dominant (101) facets and the facades of the particles are enclosed by (101) facets. Besides, trace CaCO3 impurities that originated from the reaction of Ca(OH)2 and CO2 in air were found. The strongest (101) peak was used to calculate the crystal sizes of the samples by the Scherrer equation and the mean size is 38 nm. Thermal processing of Ca(OH)2 in the phosphate solution at 1100 oC produces a solid material with porous texture, white color, high mechanical strength and pores with irregular diameters. The present XRD results suggest that the HAp stability in the bone matrix was not disrupted when calcined in air up to 1200 °C, as the chemical structure of HAp has not been affected and no other peak was obtained apart from HAp. The crystalline composition of calcined fish (bones and scales), snail shells, bovine bones, horse bones, egg shells, cuttlefish bones and crab shells were found to be similar to that of HAp (JCPDS-09-0432/1996) when calcined between 600–1100 °C. It is well known that as the temperature increases the intensity of the peak increases with a decrease in the peak width. The intensity of the raw fish (bones and scales), snail shells, bovine bones, horse bones, egg shells, cuttlefish bones and crab shells were found to be dispersed by X-ray radiation with a lowered intensity and wider peak. This may be due to the presence of extracellular matrix and fibrous proteins. When subjected to calcination at higher temperatures, the subsequent peaks were highly intense and sharp, indicating the removal of organic portion. From these results, it is evident that HAp derived at different temperatures is very close to the standard hexagonal HAp in purity and stability. The relative intensity of calcined (bones, scales and shells) were found to be closest to standard HAp at 1100 °C. The 2θ angles varied a little in comparison to standard HAp, which might be due to the trace removal of OH radicals. According to P. E. Wang and T. K. Chaki (1993), dehydroxylation of the HAp phase would cause a small degree of peak shifting in the XRD trace. In the present work, it was found that XRD 2θ positions of the (bones, scales and shells) samples calcined at 600 °C and 1100 °C shifted by total error of 0.056 and 0.031, respectively, thus indicating that the HAp lattice has contracted due to loss of OH radicals. XRD peak’s position which correspond to the higher intensities planes, (200) HAp, (111) HAp, (201) HAp, (002) HAp, (102) HAp, (210) HAp, (361) α-Ca3(PO4)2, (335) Ca3(PO4)2, (211) HAp, (300) HAp, (202) HAp, (400) Ca3(PO4)2, (301) HAp, (212) HAp, (310) HAp, (221) HAp, (313) HAp, (113) HAp, (203) HAp, (222) HAp, (312) HAp, (320) HAp, (213) HAp, (321) HAp, (410) HAp, (402) HAp, (004) HAp and (322) HAp of natural and artificial HAp are given in Fig. 14(A) and (B)(a-g). XRD peak’s position which correspond to the higher intensities planes, (200) HAp, (111) HAp, (201) HAp, (002) HAp, (102) HAp, (210) HAp, (361) α-Ca3(PO4)2, (335) Ca3(PO4)2, (211) HAp, (300) HAp, (202) HAp, (400) Ca3(PO4)2, (301) HAp, (212) HAp, (310) HAp, (221) HAp, (313) HAp, (113) HAp, (203) HAp, (222) HAp, (312) HAp, (320) HAp, (213) HAp, (321) HAp, (410) HAp, (402) HAp, (004) HAp and (322) HAp of artifical HAP are given in Fig. 15. The phase purity and crystalline nature of the pure and doped HAp powder nanostructures prepared at different temperatures were analyzed using XRD. Fig. 16 shows the XRD pattern for the pure and doped HAp nanostructured particles obtained at different temperatures. The diffraction peaks in the XRD pattern matched the pure HAp hexagonal phase. The absence of the characteristic peaks, given by impurities or secondary phases, indicates that the HAp highly pure crystalline phase has formed at 1100˚C. However, the peak profile is very broad thus accounting for both the nanocrystalline condition of materials and lattice large disorder. XRD peak’s position which correspond to the higher intensities planes, (200) HAp, (111) HAp, (201) HAp, (002) HAp, (102) HAp, (210) HAp, (361) α-Ca3(PO4)2, (335) Ca3(PO4)2, (211) HAp, (300) HAp, (202) HAp, (400) Ca3(PO4)2, (301) HAp, (212) HAp, (310) HAp, (221) HAp, (313) HAp, (113) HAp, (203) HAp, (222) HAp, (312) HAp, (320) HAp, (213) HAp, (321) HAp, (410) HAp, (402) HAp, (004) HAp and (322) HAp of artificial HAp are given in Fig. 16(a)-(o).
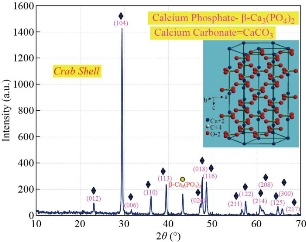
Fig. 11 Diffractogram of crab shell before treated temperatures.
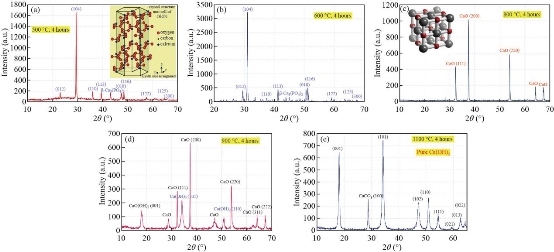
Fig. 12 Diffractogram of crab shell after treated temperatures at (a) 500 oC, (b) 600 oC, (c) 800 oC, (d) 900 oC and (e) 1100 oC for 4 hours.
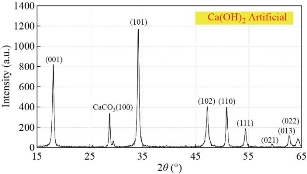
Fig. 13 Diffractogram of artificial Ca(OH)2.
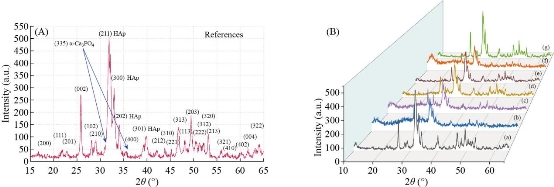
Fig. 14 (A) XRD pattern for HAp references. (B) XRD pattern for HAp fabricated from different natural sources: (a) Fish (bones and scales), (b) snail shells, (c) bovine bones, (d) horse bones, (e) egg shells, (f) cuttlefish bones, and (g) crab shells at treated temperature 1100 oC.
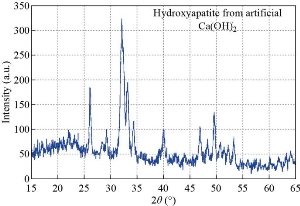
Fig. 15 XRD pattern for HAp fabricated from artificial Ca(OH)2.
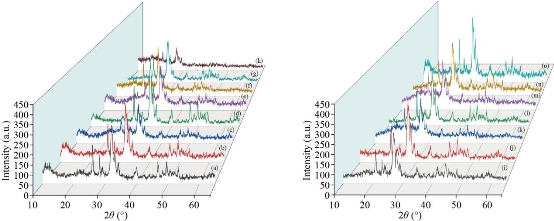
Fig. 16 XRD of pure hydroxyapatite at treated temperature: (a) 800 °C, (b) 900 °C, and (c) 1100 °C; XRD pattern of doped HAp fabricated from artificial source: (d) HAP : Ag, (e) HAP : Sr, (f) HAP : Er, (g) HAP : Nd, (h) HAP : Sm, (i) HAP : Eu, (j) HAP : Gd, (k) HAP : Ca, (l) HAP : Al2O3, (m) HAP : MgO, (n) HAP : ZnO, and (o) HAP : Fe2O3 treated at 1100 °C.
Fourier transform infrared spectroscopy (FTIR)
FTIR is a promising tool to identify unknown substances and to determine the amount of components in a given sample. This test was performed to get authenticated information about the vibrational origin of the phosphate, carbonate and to confirm the production of HAp with no association of organic moieties. The FTIR spectrum of raw (bones, scales and shells) and derived HAp at different temperatures is shown in Fig. 17(a)-(h). The FT-IR spectrum of bones, scales and shells calcined between temperatures of 500 °C to 1100 °C revealed the only characteristic peak of HAp. A large number of bands in the spectra (601, 631, 873, 962, 962, 1027, 1088, 1413, 1454, 2034, 2157 cm−1 and a broad band observed between 3000–3600 cm−1) matched the bands in the HAp reference spectrum. At lower temperatures (500 °C and 600 °C), the peak corresponding to the phosphate (![]() ) group at 1088 cm−1 was not observed and it appeared only at temperatures above 600 °C. This may be due to the removal of all the organic material from the raw (bones, scales and shells) and formation of HAp crystals. Thermal stability is an important feature of derived HAp. On the contrary, no phase transformation due to calcination was observed in our study even at high temperatures (500 °C to 1100 °C). Subsequently, peaks at 1026–1088 cm−1 and 960.55 cm−1 are attributed to
) group at 1088 cm−1 was not observed and it appeared only at temperatures above 600 °C. This may be due to the removal of all the organic material from the raw (bones, scales and shells) and formation of HAp crystals. Thermal stability is an important feature of derived HAp. On the contrary, no phase transformation due to calcination was observed in our study even at high temperatures (500 °C to 1100 °C). Subsequently, peaks at 1026–1088 cm−1 and 960.55 cm−1 are attributed to ![]() . Additionally; all the FTIR spectra samples exhibited a peak at 632 cm−1 and a broad peak at 3300–3600 cm−1 due to the presence of the hydroxyl group. The intense peaks observed at 1413 and 1457 cm−1 in the spectrum of calcined bones, scales and shells are attributed to
. Additionally; all the FTIR spectra samples exhibited a peak at 632 cm−1 and a broad peak at 3300–3600 cm−1 due to the presence of the hydroxyl group. The intense peaks observed at 1413 and 1457 cm−1 in the spectrum of calcined bones, scales and shells are attributed to ![]() . The pure hydroxyapatite phase with some carbonate substitution is formed only after 800-900 oC. However, surface OH bands are also present in the spectrum. After heat treatment (1100 oC), spectral features of the apatite phase become dominant. For the detailed functional groups and compositions present, the synthesized HAP nanostructures were examined by FTIR. FTIR spectra of the as prepared artificial HAp nanostructures are depicted in Fig. 18 and Table 8. It is clear that the broad bands at 3568.31 cm-1 arise from hydroxyl stretching and vibrational modes of OH due to the presence of an organized water structure in HAP and/or hydrated layer along with HAP. The carbonate band
. The pure hydroxyapatite phase with some carbonate substitution is formed only after 800-900 oC. However, surface OH bands are also present in the spectrum. After heat treatment (1100 oC), spectral features of the apatite phase become dominant. For the detailed functional groups and compositions present, the synthesized HAP nanostructures were examined by FTIR. FTIR spectra of the as prepared artificial HAp nanostructures are depicted in Fig. 18 and Table 8. It is clear that the broad bands at 3568.31 cm-1 arise from hydroxyl stretching and vibrational modes of OH due to the presence of an organized water structure in HAP and/or hydrated layer along with HAP. The carbonate band ![]() of impurity ion appears at 1423.47 cm-1 due to the sample preparation in the atmosphere, which leads to dissolve
of impurity ion appears at 1423.47 cm-1 due to the sample preparation in the atmosphere, which leads to dissolve ![]() to carbonate that replace
to carbonate that replace ![]() ion in HAp lattice. Also, the band appears at 1462.04 cm-1 according to replace OH ions in HAp lattice. The presence of three distinct bands at 469, 603 and 964 cm-1 are due to symmetric metal-oxygen PO stretching vibration of
ion in HAp lattice. Also, the band appears at 1462.04 cm-1 according to replace OH ions in HAp lattice. The presence of three distinct bands at 469, 603 and 964 cm-1 are due to symmetric metal-oxygen PO stretching vibration of![]() which confirm the formation of hexagonal hydroxyapatite. In addition to this an absorption bands appeared at 1033 and 1097 cm-1 is attributed to asymmetric stretching modes. In conclusion, it is interesting to note that the sharp peaks belonging to the hydroxyl and phosphate groups in FTIR spectrum of HAP sample support the well crystallized apatite structure and all bands in FTIR spectra showed the typical bands of HAP.
which confirm the formation of hexagonal hydroxyapatite. In addition to this an absorption bands appeared at 1033 and 1097 cm-1 is attributed to asymmetric stretching modes. In conclusion, it is interesting to note that the sharp peaks belonging to the hydroxyl and phosphate groups in FTIR spectrum of HAP sample support the well crystallized apatite structure and all bands in FTIR spectra showed the typical bands of HAP.
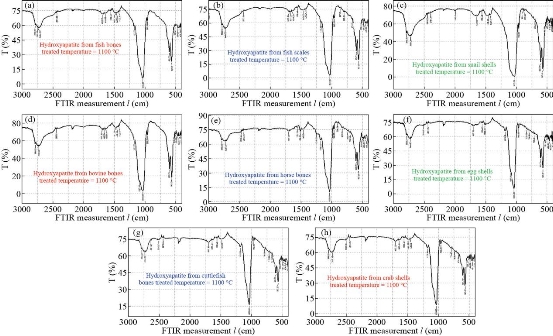
Fig. 17 FTIR spectra for natural HAp (a) fish bones, (b) fish scales, (c) snail shells, (d) bovine bones, (e) horse bones, (f) egg shells, (g) cuttlefish bones, and (h) crab shells.

Fig. 18 FTIR spectra for artificial HAp: (a) pure HAP, (b) HAP : Ag, (c) HAP : Sr, (d) HAP : Er, (e) HAP : Nd, (f) HAP : Sm, (g) HAP : Eu, (h) HAP : Gd, (i) HAP : Al2O3, (j) HAP : MgO, (k) HAP : ZnO, and (o) HAP : Fe2O3 treated at 1100 °C.
Table 8 FTIR spectra for artificial HAp.
|
Characteristic frequencies |
Vibration frequencies (v/cm) |
|
Experimental data |
|
|
PO4 of bending (v4) |
~605 - 607 |
|
OH structural |
~630 -635 |
|
CO3 group (v3) |
~873 - 875 |
|
PO4 tension (v1) |
~960 - 961 |
|
PO4 bending (v3) |
~1031 - 1050 |
|
PO4 bending (v3) |
~1087 - 1090 |
|
CO3 group (v3) |
~1424 - 1429 |
|
OH structural |
~3571 - 3572 |
The 31P MAS-NMR spectra of HAp
The 31P MAS-NMR spectra were acquired on all samples. As an example, 31P MAS-NMR spectra of hydroxyapatite samples treated at 800, 900 and 1100°C are compared in Fig. 19. The spectrum of the sample treated at 800 and 900°C (lower spectrum in Fig. 19) shows the typical hydroxyapatite peak at 2.57 ppm together with an additional broad foot. It indicates the presence of nanoscopic particles with a low degree of crystallinity. The corresponding peak of the sample treated at 1000°C (upper spectrum in Fig. 19) differs from the previous in narrow line-width and for the absence of the broad foot indicating an increase of particles size and crystallinity. The 31P MAS-NMR spectra for the pure hydroxyapatite nanostructure and hydroxyapatite doped with different materials are given in Fig. 20. A distinctive resonance peak appears at 2.57 ppm in Fig. 20 for the nano hydroxyapatite. After the development of doping hydroxyapatite nanoparticles, the 31P characteristic peak moves to 2.66 ppm as shown in Fig. 20, indicating that after the formation of doping hydroxyapatite nanostructure, the chemical environment of the phosphorus atom in nano hydroxyapatite crystal has been changed. This shift is due to the interaction of hydroxyapatite with materials in doping hydroxyapatite nanostructure. It is well known that HAp structure consists of Ca, PO4 and OH groups closely packed together. The OH− and ![]() groups are responsible for negativity of HAp surface and Ca2+ ions form the positive group. The chemical interaction may be due to the hydrogen bonding interaction between the
groups are responsible for negativity of HAp surface and Ca2+ ions form the positive group. The chemical interaction may be due to the hydrogen bonding interaction between the ![]() ions of HAp and the OH– functional groups of HAp.
ions of HAp and the OH– functional groups of HAp.
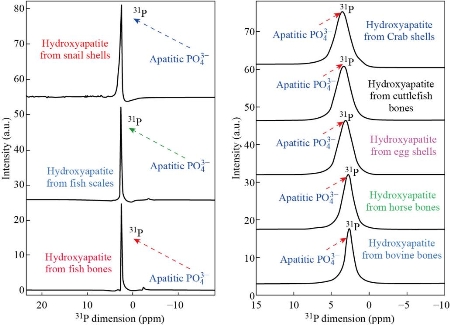
Fig. 19 31P MAS NMR spectra of the HAp from natural sources.
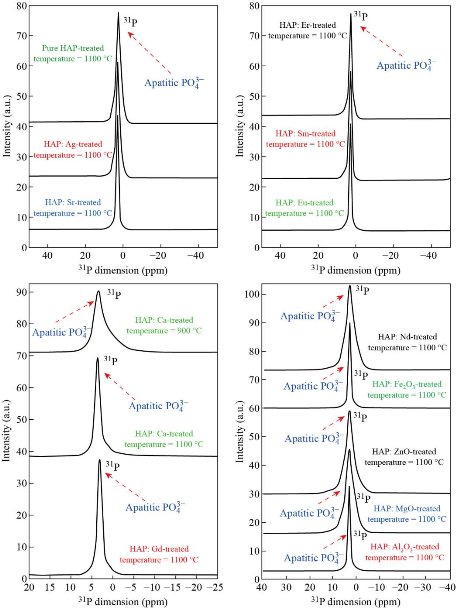
Fig. 20 31P MAS NMR spectra of the pure and doped HAp at treated temperature 1100 °C.
Raman spectra of hydroxyapatite
Raman spectra of the HAp samples prepared from natural sources (fish bones, fish scales, snail shells, bovine bones, horse bones, egg shells, cuttlefish bones and crab shells) and artificial HAp at optimum conditions are shown in Fig. 21. All peaks appeared at the standard positions. The peak at 1026-1049 cm-1 (ν3) was attributed to triply degenerate asymmetric ν3(PO) stretching. The tetrahedral ![]() internal mode (ν1) observed at 960 cm-1 represents the symmetric stretching of the P-O bond. The position of this peak represents the degree of crystallinity of the material and confirmed that the prepared HAp had highly crystallized nature. Furthermore, the FWHM of the peaks at 960 cm-1 decreased when the preparation temperature was raised from 0° to 1100°C and this was due to the reduction in particle size at higher temperatures. The peaks at 576, 590 and 616 cm-1 revealed the triply degenerate bending mode of (ν4)
internal mode (ν1) observed at 960 cm-1 represents the symmetric stretching of the P-O bond. The position of this peak represents the degree of crystallinity of the material and confirmed that the prepared HAp had highly crystallized nature. Furthermore, the FWHM of the peaks at 960 cm-1 decreased when the preparation temperature was raised from 0° to 1100°C and this was due to the reduction in particle size at higher temperatures. The peaks at 576, 590 and 616 cm-1 revealed the triply degenerate bending mode of (ν4) ![]() and the 428-463 cm-1 peak represented the double degenerate bending mode of the O-P-O bond of the (ν2 )
and the 428-463 cm-1 peak represented the double degenerate bending mode of the O-P-O bond of the (ν2 ) ![]() group. The peak at 1073 cm-1 confirmed the B-type
group. The peak at 1073 cm-1 confirmed the B-type ![]() present in the HAp. The other carbonate modes such as ν2, ν3 and ν4 had weak intensities and were not detected. The weak peak observed at 1074-1076 cm-1 represented the B-type carbonate (ν3) present in the sample. The FTIR and Raman results confirmed that the pristine HAp had good crystalline nature and structural integrity. It further confirmers the occupancy of the phosphate positions in the HAp lattice by the carbonate group.
present in the HAp. The other carbonate modes such as ν2, ν3 and ν4 had weak intensities and were not detected. The weak peak observed at 1074-1076 cm-1 represented the B-type carbonate (ν3) present in the sample. The FTIR and Raman results confirmed that the pristine HAp had good crystalline nature and structural integrity. It further confirmers the occupancy of the phosphate positions in the HAp lattice by the carbonate group.
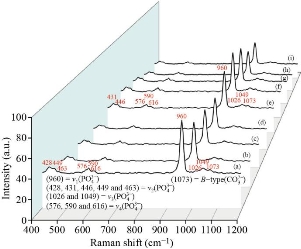
Fig. 21 Raman spectra of the natural HAp samples prepared from (a) and (b) fish (bones and scales), (c) snail shells, (d) bovine bones, (e) horse bones, (f) egg shells, (g) cuttlefish bones, (h) crab shells, and (i) HAP prepared from artifical source at treated temperature 1100 oC.
Field emission scanning electron microscope of hydroxyapatite (FESEM)
The surface morphology and crystal size of the derived hydroxyapatite were studied under FESEM. Fig. 22 shows FESEM pictures of raw bones, scales and shells derived hydroxyapatite at 600 °C, 900 °C and 1100 °C, respectively. Microcrystal of hydroxyapatite in the natural bones, scales and shells are very small, with a crystalline size of 25–30 nm, 20–25 nm wide and more than a few micrometers long. The nanostructures of raw bone, scales and shells appeared to be dense due to the presence of organic substances. The formation of nanostar, nanorod and nano rhomboid were clearly evident in the derived hydroxyapatite at 600 °C with crystal sizes 80-150 nm. Whereas, in Fig. 22, hydroxyapatite microstructures were observed with increase in temperature from 900 °C to 1100 °C. The crystal size of derived hydroxyapatite at higher temperatures (900 °C and 1100 °C) is 90-200 nm and 150-300 nm, respectively. It was conjectured from the surface morphology that the crystal size increases with respect to the temperature. The formation of these microstructures of derived hydroxyapatite in the thermal process can be attributed to the tendency of particles to crystallize and agglomerate at high temperatures. Fig. 23 shows FESEM images of samples heat-treated at 600 ºC, 800 ºC, 900 ºC and 1100 ºC, respectively. The powder obtained after heat-treatment at temperatures between 600 ºC and 800 ºC is composed by well defined, randomly oriented elongated nanorods. As the temperature increases towards 900 ºC, elongated shapes of the nanorods are maintained, but for temperatures above 900 ºC, sphere-like structures are observed. Fig. 23 exhibits the mean diameter value of nanorods versus heat-treatment temperature. For temperatures between 600 oC and 800 oC, the average diameter of the nanorods takes values in a rather narrow interval that increases with increasing temperature. Though the average diameter shows a slightly decrease at 900 oC, this is actually not a significant issue. On the other hand, for sintering temperatures above 900 oC, the mean diameter strongly increases as the temperature rises, wherein the spread of the diameter values becomes larger. The large spread may probably be due to the partial or incipient fusion of adjacent nanorods surfaces, as it may be observed in Fig. 23. Nanorods length ranges from 100 nm to~200 nm, but no correlation between length and sintering temperature could be established. Fig. 23 shows the magnified view and the rice and spherical morphology is evident. At some places the few clusters of doped HAp nanoparticles indicated the agglomeration of nanoparticles are given in Fig. 23. The size of nanoparticles was found in the range of 30 nm to 80 nm, which revealed the interesting distribution of globular shaped nano particles. A few of the globular particles appeared larger, while most of the globulars were of same size. The average edge-length of these particles was found 100 nm. Most of the particles appeared spherical with a broad size distribution from 15 to 65 nm. However, few larger spherical and near-spherical objects were also present, which could be the result of agglomeration of particles at some places on the substrate. Also it can be seen in the images that the synthesized hydroxyapatite is porous in nature. This porous nature is desirable property and can have a positive impact when used into the implant as it facilitates interaction between the implant and the biological environment. Fig. 24 shows the variation of intensity of diffracted X-rays as a function of 2θ value for the HAp:Chitosan, pure Chitosan, Na-HAp and K-HAp as a compressed spherical prills. The XRD phase identification is performed by using JCPDS standard XRD card (09-432), (72-1668) and (75-0296) for HAp, Na-HAp and K-HAp respectively. The presence of characteristic HAp peaks at 30.4◦, 31.4◦, 38.4◦, 45.2◦, 48.2◦, 51.8◦, presented in Fig. 24, confirms the hexagonal HAp structure. The peak appearing at 30.8 is due to calcium hydroxide phosphate. The analysis reveals that the majority peaks correspond to hexagonal HAp phase. The peaks found at 45.8 and 53.8 are due to Na ions (JCPDS 72-1668) of ion exchanged Na-HAp. The peak present at 45.2 shows K ions of ion exchanged K-HAp (JCPDS 75-0296). Thus the XRD study reveals that Na and K ions are also incorporated during ion exchanged process as an impurity in HAp matrix. Average crystallite size of Hap: pure Chitosan, Na-HAp and K-HAp, determined using Scherer’s formula, is found to be 16 nm, 25 nm and 18 nm respectively [25].
Fig. 22 FESEM pictures of raw bones, scales and shells derived HAp at 600 °C, 900 °C and 1100 °C, respectively.
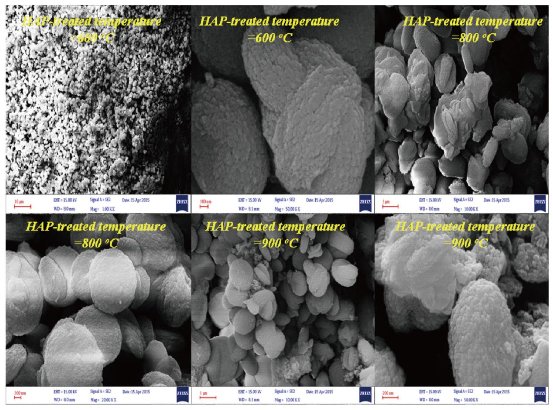
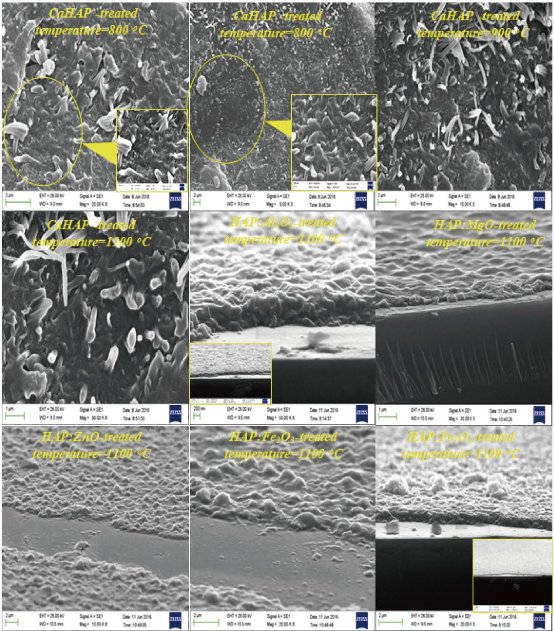
Fig. 23 FESEM pictures of pure and doped HAp at 600 °C, 800 °C, 900 °C and 1100 °C, respectively.
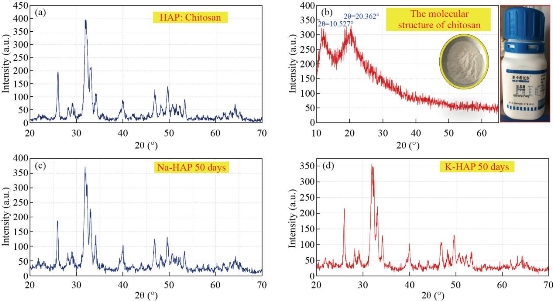
Fig. 24 X-rays as a function of 2θ value for the pure (a) HAp: Chitosan, (b) Chitosan, (c) Na-HAp and (d) K-HAp as a compressed spherical prills.
Bioactivity and biodegradation test
SBF (simulated body fluid) solution is a solution containing ions that have an approximately equal composition to human body fluids as shown in Fig. 25 and Table 9. In-vitro test is conducted to determine the bioactive properties of HAp and ion exchanged HAp material which is characterized by the growth of apatite crystals. SBF solution can be used as a medium for the growth of apatite crystals in vitro test. Apatite crystal growth requires calcium and phosphate ions [18]. Sample immersion in SBF solution was conducted for 20 days with calcium concentration observations conducted on day 6 and day 20. According to Sharma et al. (2009), the first step in apatite crystal growth is seen after seven-days immersion, because at that time period Ca2+ precipitation is occurred. Calcium concentration can be identified using AAS. Calcium concentration in the initial SBF solution was 3.44 ppm. Calcium concentrations of HAp after immersion for 6 consecutive days were 10.93 ppm, respectively. Calcium concentration of HAp after immersion for 20 consecutive days were 14.89 ppm, respectively. Table 10 shows that after the immersion in SBF solution, both natural and artificial hydroxyapatite would produce higher calcium concentrations than the initial SBF solution. This is caused by the chemical potential difference between samples with SBF solution. Ion exchange process occurs between samples and SBF solution, i.e the sample releases Ca2+ ions into the SBF solution, thus Ca2+ ions in the SBF solution increases. The analysis results showed the speed of HAp in the porous structured in improving bioactive properties as shown in Fig. 26. Pores presence would facilitate the ion exchange between the sample and the SBF solution (S. Sharma et al., 2009). Fig. 27, Fig. 28(a)-(e), and Table 11 show the FESEM and EDXS pictures of pure HAp and HAp: chitosan as a compressed spherical prills before incubation. The surface of HAp and HAp:Chitosan is found to be a porous appearance, plain and dense surface. The presence of compositional elements of HAp, HAp:Chitosan such as Ca, P, and O are detected by EDXS analysis. Fig. 27 and Fig. 28(a)-(e) show the morphology of FESEM and EDXS analysis of the surface of pure HAp and HAp:Chitosan as a compressed spherical prills after 30, 40 and 50 days of incubation respectively. The highly porous hemispherical globules are observed on HAp and HAp:Chitosan as a compressed spherical prills after 30 and 40 days of incubation in SBF. Moreover, these hemispherical globules are getting interlinked with each other after 50 days of incubation. Normally, the formation of a dense apatite layer is observed on porous bioactive materials from SBF solution, but the formation of porous interlinked apatite layer from SBF is rarely reported. These porous apatite layers can enhance the osteointegration and osteoconduction properties for medical applications. This kind of activity shows that after incubation in SBF, HAp and HAp:Chitosan accelerate the process of mineralization in the vicinity of actual bone material in practical studies. Energy Dispersive Spectroscopic analysis of both the compressed spherical prills incubated in SBF after 30, 40 and 50 days shows the presence of elements Ca, P, O as well as C, Na, Mg and Cl. The major peaks due to Ca, P and O confirm the growth of calcium phosphate layer on the HAp and HAp: Chitosan surface, as shown in Fig. 27 and Fig. 28(a)-(e) . When a material is incubated in SBF solution, the formation of apatite layer on the surface of pellet goes through a sequence of chemical reactions like spontaneous precipitation, nucleation and growth of calcium phosphate. It has been suggested that surface chemistry plays an important role in this process and even the functional groups of materials have a large effect on the bonebonding property. It is well known that HAp and HAp:Chitosan structure consists of Ca, PO4 and OH groups closely packed together. The OH− and ![]() groups are responsible for negativity of HAp surface and Ca2+ ions form the positive group. The process of apatite formation mainly depends on negative group, which in turn depends on the large number of negative ions (i.e. OH− and
groups are responsible for negativity of HAp surface and Ca2+ ions form the positive group. The process of apatite formation mainly depends on negative group, which in turn depends on the large number of negative ions (i.e. OH− and ![]() ) on the surface. During incubation period, the positive Ca2+ ions from SBF are attracted by the OH− and
) on the surface. During incubation period, the positive Ca2+ ions from SBF are attracted by the OH− and ![]() ions present on HAp surface. Therefore, the surface gains positive charge with respective to the surrounding SBF and further attracts the negatively charged OH− and
ions present on HAp surface. Therefore, the surface gains positive charge with respective to the surrounding SBF and further attracts the negatively charged OH− and ![]() ions from the SBF. This leads to formation of the apatite layer. Fig. 29(a) and (b), and Fig. 30 show the growth of apatite on ion exchanged Na-HAp and K-HAp prills using SEM morphology and elemental analysis by EDXS. EDXS shows meager quantity of Na and K due to small concentration of Na and K (0.1m) during ion exchange. The presence of Na and K is prominently seen in XRD spectra as mentioned earlier. There is no systematic growth of porous apatite layer on ion exchanged samples, showing that Na and K assisted HAp prills do not accelerate the growth of HAp on to itself. However, deposits of HAp can be observed, normally at Na and K deficient sites, as seen by the agglomeration of HAp at discrete sites over the surface. The crystallites grow separately and do not adhere to each other. The porosity within individual grain increases, which is a good sign for bioactivity in vitro for ion exchanged samples [25].
ions from the SBF. This leads to formation of the apatite layer. Fig. 29(a) and (b), and Fig. 30 show the growth of apatite on ion exchanged Na-HAp and K-HAp prills using SEM morphology and elemental analysis by EDXS. EDXS shows meager quantity of Na and K due to small concentration of Na and K (0.1m) during ion exchange. The presence of Na and K is prominently seen in XRD spectra as mentioned earlier. There is no systematic growth of porous apatite layer on ion exchanged samples, showing that Na and K assisted HAp prills do not accelerate the growth of HAp on to itself. However, deposits of HAp can be observed, normally at Na and K deficient sites, as seen by the agglomeration of HAp at discrete sites over the surface. The crystallites grow separately and do not adhere to each other. The porosity within individual grain increases, which is a good sign for bioactivity in vitro for ion exchanged samples [25].
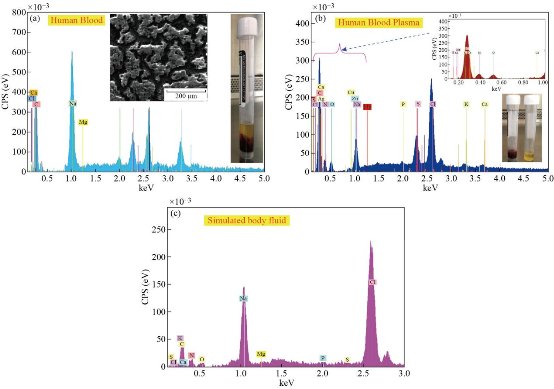
Fig. 25 (a) Human blood, (b) human blood plasma, and (c) simulated blood plasma.
Table 9 Ion concentrations (mmol/dm3) of SBF and human blood plasma, and reagents used for preparing SBF (1 l, pH 7.4).
|
Ionic concentration (mmol/dm3) simulated body fluid blood plasma |
Simulated body fluid |
Blood plasma |
|
Na+ |
142 |
142 |
|
K+ |
5.0 |
5.0 |
|
Mg+ |
1.5 |
1.5 |
|
Ca+ |
2.5 |
2.5 |
|
Cl- |
147.8 |
103.0 |
|
HCO3- |
4.2 |
27.0 |
|
HPO4- |
1.0 |
1.0 |
|
SO4- |
0.5 |
0.5 |
|
Order |
Reagent |
Amount |
|
1 |
NaCl |
7.996 g |
|
2 |
NaHCO3 |
0.350 g |
|
3 |
KCl |
0.224 g |
|
4 |
K2HPO4.3H2O |
0.228 g |
|
5 |
MgCl2.6H2O |
0.305 g |
|
6 |
1 M HCl |
40.0 mL |
|
7 |
CaCl2 |
0.278 g |
|
8 |
Na2SO4 |
0.071 g |
|
9 |
(CH2OH)3CNH2 |
6.057 g |
Table 10 After the immersion in SBF solution, both natural and artificial hydroxyapatite would produce higher calcium concentrations than the initial SBF solution
|
Time |
Calcium concentration (ppm) |
||||||||
|
Fish bones |
Fish scales |
Snail shells |
Bovine bones |
Horse bones |
Egg she;;s |
Cuttlefish bones |
Crab shells |
Artificial hydroxyapatite |
|
|
0 |
3.44 |
3.44 |
3.44 |
3.44 |
3.44 |
3.44 |
3.44 |
3.44 |
3.44 |
|
6 |
10.81 |
10.63 |
10.73 |
10.81 |
10.42 |
10.71 |
10.65 |
10.93 |
9.36 |
|
20 |
14.89 |
14.77 |
14.68 |
14.57 |
14.48 |
14.38 |
14.18 |
14.09 |
13.73 |
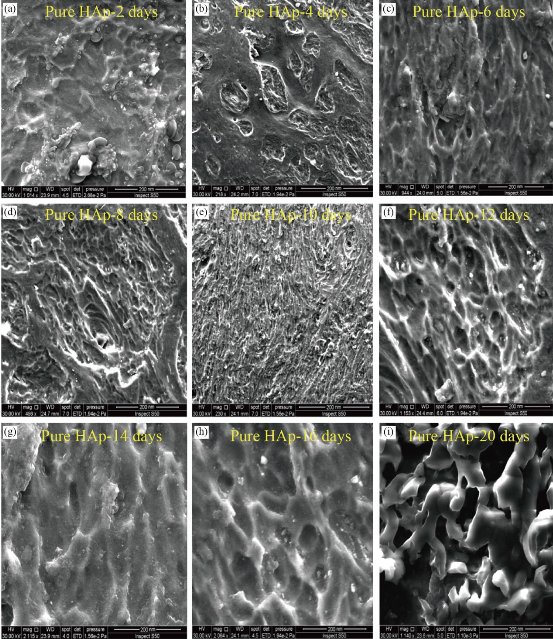
Fig. 26 FESEM results of HAp in the porous structured in improving bioactive properties: (a) HAp-2 days, (b) HAp-4 days, (c) HAp-6 days, (d) HAp-8 days, (e) HAp-10 days, (f) HAp-12 days, (g) HAp-14 days, (h) HAp-16 days, and (i) HAp-20 days.
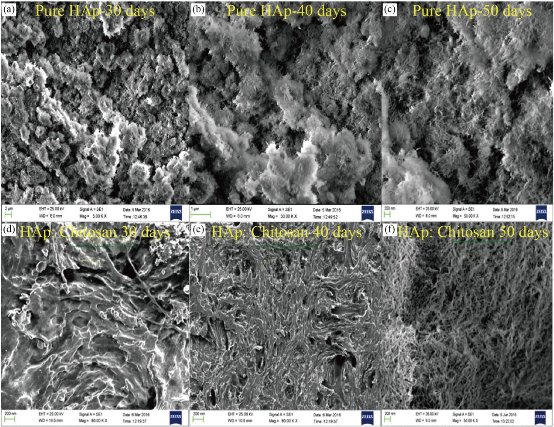
Fig. 27 FESEM images of pure HAp and HAp : Chitosan prills before incubation: (a) HAp-30 days, (b) HAp-40 days, (c) HAp-50 days, (d) HAp : Chitosan - 30 days, (e) HAp : Chitosan - 40 days, and (f) HAp : Chitosan - 50 days.
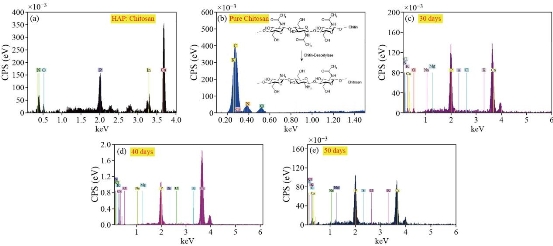
Fig. 28. EDXS of (a) pure HAp, (b) HAp : Chitosan, (c) 30 days, (d) 40 days and (e) 50 days prills before incubation.
Table 11 EDXS of pure chitosan prills before incubation.
|
Element |
AN |
Series |
wt.% |
Norm. wt.% |
Norm. at.% |
Error in wt.% (1 Sigma) |
|
Carbon |
6 |
K-series |
59.45983 |
59.45983 |
64.80356 |
9.60283 |
|
Nitrogen |
7 |
K-series |
27.21613 |
27.21613 |
25.43577 |
7.695668 |
|
Oxygen |
8 |
K-series |
11.04777 |
11.04777 |
9.039101 |
3.496896 |
|
Silicon |
14 |
K-series |
1.191735 |
1.191735 |
0.555459 |
0.144775 |
|
Rubidium |
37 |
L-series |
1.084535 |
1.084535 |
0.16611 |
0.155479 |
|
-- |
-- |
Sum: |
100 |
100 |
100 |
-- |
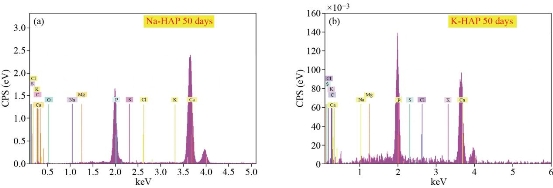
Fig. 29 EDXS show the growth of apatite on ion exchanged: (a) Na-HAp and (b) K-HAp pellets.
Fig. 30. FESEM show the growth of apatite on ion exchanged Na-HAp and K-HAp prills: (a) and (b) HAp-Na 30 days, (c) and (d) HAp-Na 40 days, (e) HAp-Na 50 days, (f) and (g) HAp-K 30 days, (h) and (i) HAp-K 40 days, (j), (k) and (l) HAp-K 50 days.
Conclusions
EDX data for derived HAp from natural sources at 600°C, 800°C, 900°C and 1100 °C, respectively. Based on the EDX signatures, the Ca/P weight ratio for derived HAp was calculated and was found to be 1.67 at 600°C, 800°C, 900°C and 1100 °C, respectively. In the present work, it was found that XRD 2θ positions of the (bones, scales and shells) samples calcined at 600 °C and 1100 °C shifted by total error of 0.056 and 0.031, respectively, thus indicating that the HAp lattice has contracted due to loss of OH radicals. XRD peak’s position which correspond to the higher intensities planes, (200) HAp, (111) HAp, (201) HAp, (002) HAp, (102) HAp, (210) HAp, (361) α-Ca3(PO4)2, (335) Ca3(PO4)2, (211) HAp, (300) HAp, (202) HAp, (400) Ca3(PO4)2, (301) HAp, (212) HAp, (310) HAp, (221) HAp, (313) HAp, (113) HAp, (203) HAp, (222) HAp, (312) HAp, (320) HAp, (213) HAp, (321) HAp, (410) HAp, (402) HAp, (004) HAp and (322) HAp of natural and artificial HAp. XRD pattern for the pure and doped HAp nanostructured particles obtained at different temperatures. The diffraction peaks in the XRD pattern matched the pure HAp hexagonal phase. The absence of the characteristic peaks, given by impurities or secondary phases, indicates that the HAp highly pure crystalline phase has formed at 1100˚C. However, the peak profile is very broad thus accounting for both the nanocrystalline condition of materials and lattice large disorder. The peak at 1026-1049 cm-1 (ν3 ) was attributed to triply degenerate asymmetric ν3(PO) stretching. The tetrahedral ![]() internal mode (ν1) observed at 960 cm-1 represents the symmetric stretching of the P-O bond. The position of this peak represents the degree of crystallinity of the material and confirmed that the prepared HAp had highly crystallized nature. The peaks at 576, 590 and 616 cm-1 revealed the triply degenerate bending mode of (ν4)
internal mode (ν1) observed at 960 cm-1 represents the symmetric stretching of the P-O bond. The position of this peak represents the degree of crystallinity of the material and confirmed that the prepared HAp had highly crystallized nature. The peaks at 576, 590 and 616 cm-1 revealed the triply degenerate bending mode of (ν4) ![]() and the 428-463 cm-1 peak represented the double degenerate bending mode of the O-P-O bond of the (ν2 )
and the 428-463 cm-1 peak represented the double degenerate bending mode of the O-P-O bond of the (ν2 ) ![]() group. The peak at 1073 cm-1 confirmed the B-type
group. The peak at 1073 cm-1 confirmed the B-type ![]() present in the HAp.
present in the HAp.
Conflict of Interests
1. The authors declare that no competing interest exists.
2. Manufacture of non-toxic biological materials using simple, inexpensive methods
3. The possibility of using the materials prepared by medical applications.
References
Copyright© Marwa Abdul Muhsien Hassan, Asmaa Hadi Mohammed, and Wahab Basim Mahdi. This is an open-access article distributed under the terms of the Creative Commons Attribution License, which permits unrestricted use, distribution, and reproduction in any medium, provided the original author and source are credited.

|
Nano Biomedicine and Engineering. Copyright © Shanghai Jiao Tong University Press |
 |