Chemical Detection of the Toxicity of Nanoparticles of Metals and Metal Oxides
Suad Ahmed Rashdan*
Department of Chemistry, College of Science, University of Bahrain, Sakheer, P. O. Box 32038, Kingdom of Bahrain
* Corresponding author. E-mail: suadr@hotmail.com, srashdan@uob.edu.bh
Received: Apr. 29, 2021; Accepted: Dec. 2, 2021; Published: Dec. 13, 2021
Citation: Suad Ahmed Rashdan, Chemical Detection of the Toxicity of Nanoparticles of Metals and Metal Oxides. Nano Biomed. Eng., 2021, 13(4): 401-413.
DOI: 10.5101/nbe.v13i4.p401-413.
Abstract
The wide applications of nanoparticles increased the demand for their risk assessment, a number of studies on the diverse effects of nanoparticles on various systems have been published. This review provides an overview of the mechanisms of cellular uptake of nanoparticles (NPs) and the advanced toxicological studies of the nanoparticles of metals and metal oxides on various systems (in-vitro and in-vivo).
Keywords: Metal oxide NPs, Toxicity assays and their mechanisms, Detoxification mechanism
Introduction
The unique physiochemical, electrical, optical and magnetic properties of various types of nanomaterials make them desirable candidates in large spectrum of applications including biotechnology, medical, electronic and cosmetics, biosensors, etc. Extensive production, wide applications and disposal of various types of nanomaterials raise great concern regarding their possible risks to human health, living organisms and environment. The major routes for nanomaterials uptake in terrestrial organisms are through respiration and ingestion. In aquatic organisms, nanoparticles may cross the external surface or inter directly through gills. The internalization of nanoparticles inside the cells usually occurs via endocytosis whereas in plants, algae and fungi, pores permit nanoparticles entry. Once inside the cell, nanoparticles can bind cell organelles and consequently affect various metabolic processes and may eventually lead to cell death. Therefore, studying the toxicological properties of different types of nanomaterials is essential and accordingly several toxicity assays have been developed and showed their effectiveness in the determination of the cellular toxicity of various types of nanoparticles.
Biological Intake of Nanoparticles
There are many factors that influence cellular nanoparticle (NPs) uptake including size, shape, material and surface coating of nanoparticles, as well as the cell type, age, interaction with other cells and the cellular environment [1]. In addition, positively charged NPs undergo endocytic processing by cells more favourably because they can interact with the negatively charged phospholipid components of the cell membrane [2,3]. Nanoparticles (NPs) are up taken by organism via various pathways including adhering to the cell, ion transfer systems, and endocytosis. The adhered nanoparticles may block cell pores and consequently disturb the membrane functions. Charged nanoparticles inter the cell by ion transporters which are proteins that transfer ions across the cell membrane through active transport process [4]. Endocytosis is a process in which cells absorb external particles into the cell by immersing them in the cell membrane and it involves two different mechanisms: pinocytosis which describes the uptake of molecules and fluids within small vesicles and phagocytosis which involves engulfing of large particles [5] and it includes different mechanisms [6-13]. In plant. algae and fungi, interactions of nanoparticles with the pores in the cell wall results in the formation of bigger pores which enhances the internalization of the nanoparticles [14]. Oxidative stress is imbalance between oxidants and antioxidants. Reactive Oxygen Species (ROS) are active molecules which produce in the cells during signalling and homeostasis. ROS include super oxide oxygen anion (O2.-), hydroxyl radical (OH∙), hydrogen peroxide (H2O2), singlet oxygen (1O2), and hypochlorous acid (HOCl), are produced by electron reduction catalysed by nicotinamide adenine dinucleotide phosphate (NADPH) oxidase [14]. Nanoparticles produce ROS when oxidants or free radicals bind to the particle surface which result in the formation of surface-active sites that interact with atmospheric oxygen to form additional radicals. Dissolution of NPs and the release of metal ions induces ROS generation [15]. Transition metal NPs accelerate the formation of ROS via Fenton-type mechanisms as illustrated in Fig. 2 [16]. Transition metal complexes are used in photodynamic therapy, because during irradiation, these complexes undergo photoinduced electron transfer and bioactive ligand release reactions. These reactions result in the generation of reactive species that can contribute to various effects [17]. In vitro or vivo, the formation of ROS is commonly detected by using 2’,7’-dichlorodihydrofluorescein diacetate (DCFDA) probe [18]. DCFDA is an oxidant-sensing, non-fluorescence, cell permeable dye which is hydrolysed inside the cell by cellular esterase to its nonhydrolyzed form DCF. Oxidized DCF is highly fluorescent that can be detected by various fluorescent techniques, Fig. 3 [19]. Recently several engineered nanoparticles including MgO, are proven to induce generation of ROS in different cell lines Ralstonia solanacearum showed a significant increase in DCF fluorescence intensity after treatment with 250 µg/mL of MgO [20]. NPs of NiO2 were tested on Tsticular tissue in male rats and resulted in an increase of in ROS in dose-dependent manner [21]. Testing ZnO NPs on human ovarian cancer cells (SKOV3) for about 12 h caused an increase in the generation of ROS [22, 23], Au (average size of 13 nm) citrate and 11-mercaptoundecanoic acid (MUA)-coated were the most toxic among all types of tested Au NPs and increased production of ROS [24], TiO2 and CuO NPs caused an increase in ROS level in algae after 96 h exposure [25, 26]. The cellular defence mechanism in living cells involves the detoxification of reactive species by a set of antioxidant enzymes including Glutathione S-transferases (GSTs), superoxide dismutase (SOD), catalase (CAT), Glutathione peroxidase (GPx), Glutathione reductase (GR) and Metallothioneins (MTs) [27] and non-enzymatic antioxidant such as Glutathione (GSH) [28]. These enzymes act as biomarkers to detect the oxidative damage of biomolecules and DNA in the tested cells and organisms. Next section discusses mechanisms of detoxification, most common detection methods and recent literature results of toxic effects of nanoparticles of metals and metal oxides.
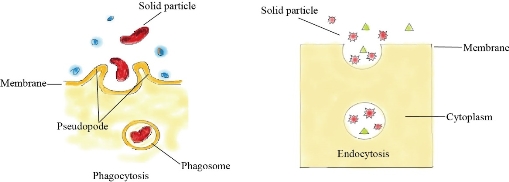
Fig. 1 Endocytosis and Phagocytosis uptake mechanisms of nanoparticles.
![]()
Fig. 2 Fenton-type reactions.
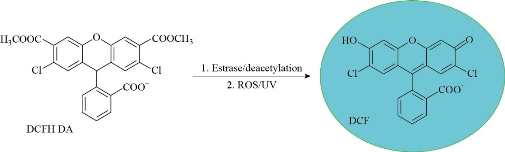
Fig. 3 Detection of Reactive Oxygen Species (ROS) using the oxidant-sensing Probe 2’,7’-Dichlorodinhyrofluresein Diacetate (DCFH-DA).
Glutathione S-Transferases (GSTs)
GST is an enzyme that supports detoxification by the enhancement of their polarity through coupling glutathione to Xenobiotic as shown in Fig. 4 [29]. GST activity can be measured spectrophotometrically with reduced glutathione and 1-chloro-2,4-dinitrobenzene [30]. GST activity was significantly increased in the digestive gland of mussels exposed to bPEI-coated nAg and decreased in the digestive gland of mussels exposed to citrate-coated nAg compared to controls [31] and an increase in GSTs activity was observed in alga Raphidocelis subcapitata upon exposure for 72 h to Ag NPs at concentration of 0.8 mg/L [32]. Exposing amazon fish (dwarf cichlid) to CuO NPs for 92 h increased activity of GST in the whole body of the fish [33], and ZnO NPs caused a decrease in level of GSH in liver of tilapia (Oreochromis mossambicus) [34].
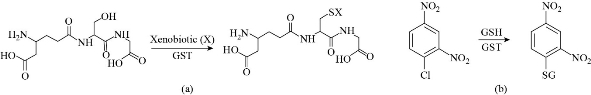
Fig. 4 Detection of GST by (a) reacting with Xenobiotic and (b) reaction of GST with 1-chloro-2,4-dinitrobenzne.
Superoxide Dismutase (SOD)
Superoxide dismutase (SOD) is an enzyme that helps the breakdown of harmful ROSs in cells by catalysing the dismutation of superoxide radical to H2O2 and molecular oxygen. Several metal cations can bind these enzymes such as Cu/Zn, Mg or Fe and Ni and undergo redox reactions as shown in Fig. 5 [35]. The activity of SOD can be measured by activity assay where xanthine-xanthine oxidase is used to generate superoxide radicals (O2.-), which is reduced by nitroblue tetrazolium (NBT). The percentage of inhibition of NBT reduction is a measure of the amount of SOD [36]. Areas where SOD is active produce clear achromatic bands with a light to dark purple appearance [36]. Some nanoparticles induced an increase in SOD activity when applied to different organisms or cells, as shown in table 1. For instance, CuO NPs induced whole body SOD activity in dwarf cichlid and cardinal tetra fish after 96 h and 24 h of exposure, respectively, [33], ZnO NPs caused an increase in SOD’s level in both liver and gills of tilapia (Oreochromis mossambicus) fish with mean SOD of 15.533±0.153 U/mg and 14.153±0.0603 U/mg, respectively [34]. SOD activity in wheat leaves increased up to 56.5 and 50.7% at concentration of 5 and 150 mg/L of TiO2 NPs, respectively [37].
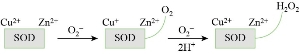
Fig. 5 SOD reaction under oxidative stress conditions.
Catalase (CAT)
Catalase (CAT) is peroxisomal hydroperoxidase that reduces hydrogen peroxide to water and oxygen (Fig. 6). It is very reactive and efficient at broad pH range. Several methods can be used to measure catalase activity, Tadayuki Iwase et al., used a method based on trapping the oxygen gas generated from the decomposition of H2O2 in the presence of Triton X-100, which can be visualized as foam and the height of the container of which it is measured is used to quantify the catalase activity [38]. Catalase activity gel is also used where green-blue with white bands are observed in the area where catalase is present [36]. Table 1, shows the influence of different metal nanoparticles on the level of activity of CAT in different organisms and cells. CAT activity in dwarf cichlid fish was increased when exposed to CuO NPs however no CAT activity was observed when cardinal tetra exposed to Cu and CuO NPs [33]. TiO2 NPs induced a decrease in CAT’s activity of wheat roots and leaves up to 88% [37] whereas, ZnO NPs showed decreasing activity of CAT in liver and increasing activity of gills in tilapia (Oreochromis mossambicus) [34].
![]()
Fig. 6 The reaction of CAT.
Glutathione (GSH)
Glutathione (GHS) is an antioxidant which maintains the oxidation state and protects the cells from oxidative damage. Free radicals trigger and reduce GHS into GSSG thus contributing to oxidative stress [39]. A reduction in GSH level in Tsticular tissue in male rats was observed when exposed to any dose of Ni NPs [21]. The level of GSH was increased in gill of tilapia (O. mossambicus) when treated with NPs of ZnO reaching 5.267±0.208 U/ mg compared to the control (4.1333±0.1155 U/mg) [34]. TiO2 NPs induced an increase in GSH level in wheat leaves at low concentration of TiO2 NPs and decreased at 50 mg/L [37].
Glutathione Reductase (GR)
GR is an enzyme that reduces glutathione disulfide GSSG to GSH which requires about 1 mole of NADPH for every mole of GSSG as shown below:
GSSG + NADPH + H+ → 2 GSH + NADP+. The activity of Glutathione reductase can be detected by observing the disappearance of NADPH band at 340 nm in near UV spectrum. GR level increased in both wheat roots and leaves when exposed to TiO2 NPs at concentrations below 150 mg/L [37]. Glutathione peroxidase (GPx) is an enzyme that catalyses the reduction of various hydroperoxides (H2O2 and lipid hydroperoxides) to water and oxygen via oxidation of reduced glutathione monomer GSH into disulfide form as shown in Fig. 7. The measurement of the activity of GPx enzyme’s is based on oxidation of GSH to GSSG and reduction of cumene hydroperoxide. Glutathione reductase (GR) then reduces GSSG to GSH and consumes NADPH. The action of GR can be monitored by tracking the disappearance of NADPH band at 340 nm in UV spectrum. Table 1, shows that treating the wheat roots with 50 and 150 mg/L of TiO2 NPs resulted in a decrease of GHS up to 80% and increase in GSSG value, whereas GSH level decreased when wheat leaves were exposed to 50 mg/L of the same NPs [37]. Oxidative stress may result in adverse biological responses including DNA fragmentation and damage, apoptosis, lipid peroxidation, and lysosomal membrane stability. These biological responses can be used as screening tools for toxic effects of NPs.
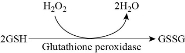
Fig. 7 The reaction of glutathione peroxidase.
DNA Fragmentation and Damage
DNA fragmentation is breaking of DNA into small fragments. ROS induce DNA damage through oxidizing nucleoside bases which can lead to G-T or G-A transversions [40]. Under oxidative stress the endonucleases enzymes, in particular Caspase-Activated DNase (CAD), are activated and result in breaking the phosphodiester bond within the polynucleotide chain and thus cleaves the DNA at the inter-nucleosomal linker sites to different lengths. DNA cleavage can be detected by using dUTP-nick-end labelling (TUNEL) assay, which is based on tagging 3’-OH group in DNA fragments with a fluorochrome such as deoxyuridine triphosphate nucleotides (dUTP) by using terminal deoxynucleotidyl transferase (TdT) enzyme, see Fig. 8 [41]. Comet assay is commenly used to measure DNA damage and is based on migrating the negatively charged DNA fragments through an agarose gel in response to an electric field. Then the fragments are stained with DNA-specific fluorescence dye such as ethidium bromide or propidium iodide. The intensity of the comet tail relative to the head reflects the number of DNA breaks, see Fig. 9 [42, 43]. The toxicity of Ag NPs of different sizes on two cell lines (Ha-CaT and HEI-OC1) was investigated using comet assay. DNA damage increased with exposure time and was inversely proportional with Ag NPs size as 5 nm NPs were the most toxic in both cell lines [44]. Fe2O3 and Fe3O4 induced an increase in DNA strand break level in BAL cells of mice at day 3 of exposure [45]. Pt NPs with size of 50 nm caused DNA damage in bronchial epithelial cells after 48 h of exposure while Au NPs of sizes of 5 and 50 nm showed an increase in DNA damage after 48 h of exposure [46]. When Ralstonia solanacearum cells treated with different concentrations of MgO NPs for 4 h, the results showed that as the concentration of MgO increased the fragmentation of DNA increased [20]. The effect of ZnO NP on damaging the DNA of human ovarian cancer cells was studied, the results showed that DNA damage increased with increasing the concentration of ZnO NPs from 10 to 30 mg/mL [22]. Citrate, silicate and polymer coated Ag NPs induced an increase in DNA breakage of mussels [31]. More examples are listed in Table 1.
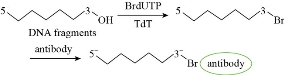
Fig. 8 Detecting and labelling DNA damage and fragmentation.
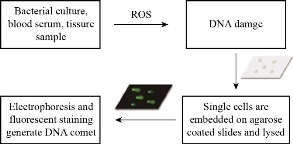
Fig. 9 Comet assay.
Table 1 Different toxicity assays applied to investigate the toxicity effect of various nanoparticles on different types of organisms collected from literature
|
Number |
Reference |
NPs |
Tested organism |
Toxicity assays |
|
1 |
18 |
FeO NPs coated with + and - surfactants |
SKOV-3 and RAW264.7 cells |
Apoptosis: determined by Annexin V/PI dual staining. After 24-h incubation, SEI-10 induced dose-dependent apoptosis in both SKOV-3 cells and RAW264.7 macrophages. The total population of early apoptosis and late apoptosis in SKOV-3 cells treated with PBS control, 2.5 µg/mL SEI-10, and 5 µg/mL SEI-10 were 4.01%, 11.52%, and 25.49%, respectively. In contrast, only mild apoptosis was observed in cells treated with SMG-10 and SMG-30 at extremely high concentration of about 100 µg/ml. ROS production: measured using DCF-DA fluorescent probe. SMG-10 and SMG-30 did not induce significant ROS formation in both cells after 18-h exposure at the concentration up to 100μg/mL, whereas SEI-10 significantly increased the production of ROS at the concentrations ranging from 5 to 20 μg/ml. |
|
2 |
20 |
MgO NPs |
Ralstonia solanacearum |
ROS: measured by using Dichlorofluorescein diacetate (DCFH-DA). A significant increase in the DCF fluorescence intensity after treatment with 250 µg/mL MgO NPs was observed. DNA damage: measured by electrophoresis analysis of genomic DNA in R. solanacearum cells treated with different concentrations of MgO NPs for 4 h. The results showed that as the concentration of the MgO NPs increased, a significant decrease in the intensity of the genomic DNA band was observed. |
|
3 |
21 |
Ni NPs |
Tsticular tissue in male rats |
CAT: reduced significantly at medium and high doses GSH: reduced significantly at any dose of Ni NPs SOD: reduced at high dose of Ni NPs. ROS: increased in a dose-dependent manner.
|
|
4 |
22 |
ZnO NPs |
human ovarian cancer cells (SKOV3) |
ROS: measured using dichlorodihydro fluorescein diacetate (DCFH-DA) staining test. Treating ZnO with cells for 12 h lead to an increase in ROS generation. DNA damage: studied using γ-H2AX staining. Results showed that the γ-H2AX signals were increased significantly in treated samples compared with controls and that the signals were dispersed throughout the whole nucleus after treatment with 10, 20, and 30 μg/mL, whereas the signals were stronger after treatment with 30 μg/m thus treatment with ZnO NPs resulted in a dose-dependent. Apoptosis: detected by using terminal deoxynucleotidyl transferase-mediated dUTP nick end labelling (TUNEL) method. ZnO NPs induced high level of apoptosis in tested cells. |
|
5 |
25 |
Ag, TiO2, SiO2, cobalt ferrite coated with poly acrylic acid (PAA). |
Neuronal cells |
ROS: Silver and TiO2 NPs induced a concentration-dependent increase in ROS while cobalt ferrite PAA and SiO2 NPs induced a decrease in ROS. Cobalt ferrite PAA NPs induced a 40 % decrease in ROS at the highest concentrations, while ROS remained at approximately 70 % of control independently of SiO2 NP concentration. |
|
6 |
26 |
CuO |
algae tropical Chlorella |
ROS: determined by using a fluorescence probe 2,7-dichlorohydrofluoroscein diacetate (H2DCFDA). ROS generation at 24 h was higher than that at 96 h in cells exposed to CuO NPs. LPO: determined using the cell permeable indicator 4,4-difluoro-5-(4-phenyl-1,3- butadienyl)-4-bora-3a,4a-diaza-s-indacene-3-undecanoic acid (C11-BODIPY). LPO level increased after exposure to CuO NPs. The 24 and 96 h exposure to CuO NP did not significantly affect the degree of lipid peroxidation. |
|
7 |
31 |
Citrate, silicate, polyvinylpyrolidone (PVP)and branched polyethylenimine (bPEI) coated Ag NPs |
mussels |
LPO: measured by using Thiobarbituric acid reactant methodology (TBARS). There were no changes in LPO levels in the gills, but there was a decrease in LPO in the digestive gland of mussels exposed to Si-coated nAg. DNA strands break: detected using alkaline comet assay, all coated Ag NPs showed increase in the DNA breakage. GST: increased in the digestive gland of mussels exposed to bPEI-coated nAg and decreased in the digestive gland of mussels exposed to citrate-coated nAg compared to controls. |
|
8 |
32 |
Ag NPs and Ag NPs coated with different ligands |
Alga Raphidocelis subcapitata |
GST: increased enzyme activity at high concentration of 0.8 mg/L of Ag NPs. CAT: increased enzyme activity at high concentration of 0.8 mg/L of Ag NPs |
|
9 |
33 |
Cu and CuO NPs |
Amazon fish, dwarf cichlid and cardinal tetra |
LPO: quantified in an assay based on the Fe+2 to Fe+3 oxidation by hydroperoxides in acid medium, in the presence of ferrous oxidation-xylenol orange, at 560 nm. CuO NPs increased LPO level in both fish. GST: determined using 1-chloro-2,4-dinitrobenzene (CDNB) as the substrate. The exposure of dwarf cichlid to Cu and CuO NPs stimulated whole body GST activity after 96 h. There were no effects on the GST activity in P. axelrodi exposed to Cu and CuO NPs. SOD: quantified based on the inhibition of cytochrome c reduction rate by the superoxide radical at 550 nm and 25 °C. The results showed that in dwarf cichlid, CuO NPs induced whole body SOD activity after 96h exposure whereas, Cu and CuO NPs induced SOD in cardinal tetra after 24 and 48 h of exposure. CAT: increased when exposed to nCuO. There were no effects on the CAT activity in P. axelrodi exposed to Cu and nCuO.
|
|
10 |
34 |
ZnO NPs |
gill and liver of tilapia (Oreochromis mossambicus) |
LPO: estimated by measuring the formation of thiobarbituric acid reactive substances (TBARS) and quantified as MDA equivalents. Lipid peroxidation (LPO) amount in gills was more as compared to the liver, whereas mean LPO in gills was 5.833±0.208 nmol/mg and 2.6767±0.0351 nmol/mg in liver. CAT: increased with the increasing concentration of ZnO-NPs in gills and decreased in liver. The mean CAT level was 12.6670±0.1530 U/mg in gills and 2.2667±0.1528 U/mg in liver. SOD: The method used to measure SOD was based on the ability of superoxide dismutase to inhibit the autooxidation of pyrogallol. SOD level was maximum in liver as compared to the gills. The mean SOD in liver was 15.533±0.153 U/mg, and it was 14.153±0.0603 U/mg in gills. GSH: GSH level was more in gills at higher concentration where mean GSH level in gills was 5.267±0.208 U/ mg and 1.1331±0.1528 U/mg in liver. DNA damage: Alkaline comet assay was used to measure DNA damage. The damage was increased with the increasing concentration of ZnO-NPs exposure and maximum % tail DNA was observed as 16.488 ± 1.215 at high concentration of 1.5 mg/L of ZnO-NPs. |
|
11 |
37 |
TiO2 NPs |
Wheat leaves and roots |
CAT: Decreased up to 88.9%. GSH: GSH decreased in 50 and 150 mg/l exposed roots (44 and 81%, respectively) and in leaves treated with 50 mg/l. In roots, GSSG increased with exposure (50 mg/l) whereas the GSH values decreased more than 80% under 50 and 150 mg/l. In leaves, GSH increased under the lowest concentration whereas decreased at 50 mg/l and GSSG decreased. GR: GR increased under 150 mg/L in both roots and leaves. SOD: In leaves increased up to 56.5 and 50.7% at 5 and 150 mg/l, respectively |
|
12 |
45 |
Ag NPs |
Cochlear Cells |
DNA strands break: DNA damage depends on the NP size and on the cell types. HEI-OC1 cells showed the most important DNA lesions compared to the HaCaT cells. DNA damage increased with time and inversely increased with Ag NPs size.
ROS production: An increase in ROS production in both types of cells, the most important being recorded after 2 h incubation and the most potent ROS producers were again the 5 nm NPs.
|
|
13 |
46 |
Spinel ferrites and Fe2O3 NPs |
mice (BAL, lung and liver cells) |
DNA damage: measured using comet assay. Increased DNA strand break levels were observed for Fe2O3 rods in BAL cells at day 3 for the two highest doses; and for the Fe2O3 particle at highest dose. No increases in DNA strand break levels were observed for lung or liver tissue. |
|
14 |
47 |
Gold, silver and platinum NPs (5 and 50 nm) |
human bronchial epithelial cells
|
DNA damage: Alkaline comet assay was used to detect DNA damage. Ag and Au NPs of size of 5 and 50 nm induced DNA strand break while Pt NPs only 50 nm NPs caused a slight increase in DNA damage.
|
|
15 |
65 |
Ag NPs (10–50 μg/ml) |
Drosophila melanogaster (insect) |
ROS: induced an increase in ROS species in fly tissues leading to apoptosis and DNA damage.
|
|
16 |
66 |
Ag NPs (mean size of 43 nm) |
New Zealand White (NZW) and Jabali rabbits |
ROS: Low dose (0.5 mg or 1.0 mg Ag NPs / Kg body weight) did not induce the oxidative stress in rabbits under heat stress conditions, while higher dose (5 mg Ag NPs / kg body weight) induced hepatic damage and oxidative stress. GSH-Px: decreased due to the increase use of GHS in reducing the effect of free radical after exposure of Ag NPs.
|
Apoptosis
Apoptosis is a structural change process that ultimately results in breaking cells into small membrane surrounded fragments. During oxidative stress intercellular caspases for cysteine, aspartyl, are activated and cleave their substrates at aspartic acid residues. Apoptosis process is associated with blebbing, cell shrinkage and chromatin condensation as shown in Fig. 10 [47]. Chromatin is a nucleoprotein that organizes DNA in eukaryotic cells, the basic component of chromatin is the nucleosome, which composes of 146 base pairs of DNAs wrapped around an octamer of histones-small basic proteins. The structure of histone is shown in Fig. 11 [48]. The nucleosomal histone tails hold acceptor sites which can be phosphorylated by a number of protein kinases. Attaching phosphoryl group can occur on serine, threonine and tyrosine residues. The phosphorylation of these residues results in a special organization of higher-order aggregates which eventually leads to a reduction of volume and less exposed surfaces of chromatin moieties in which molecules could interacts [49, 50]. Blebbing is swelling of the plasma membrane of a cell, it arises due to pressure produced in the cytoplasm when actin cortex, which is a layer of cytoplasmic proteins on the inner side of the cell membrane, experiences actomyosin contractions, leading to the expansion of the swelling from the membrane [51]. Apoptosis can be detected using various staining assays. At late stage of apoptosis cells, the aggregate chromatin binds higher amount of fluorescence dye compared to the healthy cells therefore fluorescence staining can be used to detect apoptosis. 4’,6-diamidino-2-phenylindole (DAPI) is a blue fluorescence dye that binds strongly to Adenine-thymine regions of DNA, see Fig. 12 [52]. Acridine orange / ethidium bromide (AO/EB) is a dye used to visualize nuclear changes occur during apoptosis. Acridine orange (AO) makes the nuclei appear green while ethidium bromide (EB) stains apoptotic cells and the nuclei appear orange to red, Fig. 13 [53]. During apoptosis the membrane phosphatidylserine (PS) is translocated from the inner to outer surface of the plasma membrane [55]. This flipping can be detected by using Annexin V which is a protein that binds to the flipped negative-charged PS in the presence of Ca2+ ions and does not bind to healthy cells as shown in Fig. 14 [56]. Different types of coated iron oxide NPs (SEI-10, SMG-10 and SMF-30) induced apoptosis in two cell lines Viz SKOV-3 and RAW264.7 which was determined using Annexin V/PI dual staining. After 24h of incubation, SEI-10 NPs induced dose-dependent apoptosis in both cell lines. The total population of control, early apoptosis and late apoptosis of SEI-10 cells were 4.01%, 11.52%, and 25.49%, respectively whereas only mild apoptosis was observed in cells treated with other types of coated iron oxide NPs at high concentration of 100 µg/ml [18]. ZnO NPs induced high level of apoptosis in human cancer cells which was confirmed by TUNEL test [22].
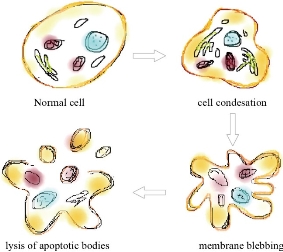
Fig. 10 Pathway of apoptosis process.
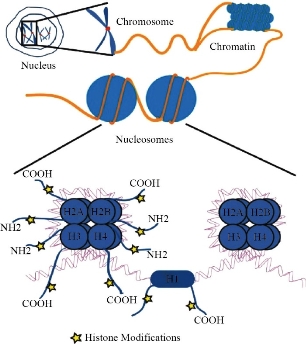
Fig. 11 Structure of chromatin [50].
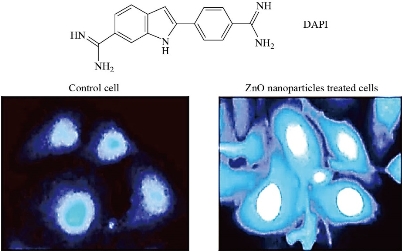
Fig. 12 DAPI staining in apoptosis cells [52].
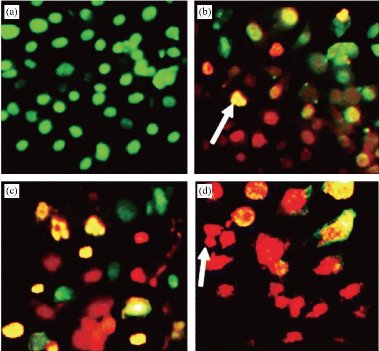
Fig. 13 Apoptotic morphology detection by acridine orange-ethidium bromide (AO/EB) fluorescent staining of RD cell line treated with ergone dissolved in methanol: DMSO (1:1). a- Negative control; (b)-2 μM; (c)- 5 μM; (d)- Cycloheximide as the positive control (5 mM; 50 μL) (×40). Arrows indicate formation of apoptotic bodies [54].
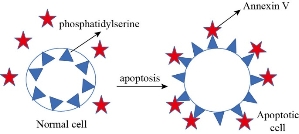
Fig. 14 Reaction between Annexin V and apoptotic cell.
Lipid Peroxidation (LPO)
LPO is an oxidation process appears by the attack of ROS in particular hydroperoxide (HO2.) and hydroxide (HO.) radicals, on phospholipids of the cell membrane and produces radical fatty acids that react with free fatty acids to produce aldehydes, ketones, alkanes and carboxylic acids. ROS abstract allylic hydrogen from polyunsaturated fatty acids to form carbon lipid radical which rapidly reacts with molecular oxygen to form new lipid radicals. These radical species abstract hydrogen from antioxidants producing wide variety of non-radical molecules such as malondialdehyde (MDA), propanal, and hexanal, as shown in Fig. 15 [57]. Lipid peroxidation can be measured using different methods including measuring the amount of losses of fatty acids; measuring the volume of carbonyls and hydrocarbon gases; and measuring the reduction of antioxidant activity. Since MDA is considered as the most common product of lipid peroxidation, it is used as biomarker for lipid epoxidation which can be measured using thiobarbituric acid (TBA) test in which lipid containing sample is heated with TBA at low pH and resulting in a pink colour complex. The intensity of the colour of the pink complex is related to the extent of LPO [59] (Fig. 16, [60]). MDA can be detected by using derivatives that react with carbonyl group of MDA including 2,4- dinitrophenyl hydrazine (DNPH), pentafluorophenyl hydrazine (PFB) and 2,4- diaminonaphthalene (DAN) which can be analysed by spectroscopic analysis, see Fig. 17 [59]. Incubating HEP G2 cells with Ag NPs for 24 h with 25 µg/ml and 50 µg/ml silver nanoparticles resulted in an increase in the LPO level at elevated glucose concentration [61]. Different coated Ag NPs showed no significant change in the level of LPO in the gills of mussels, but there was a decrease in the LPO level in the digestive gland of mussels exposed to Si-coated Ag NPs [31]; Treating dwarf cichlid and cardinal tetra fish with CuO NPs led to an increase in LPO level in both fishes [33]. ZnO NPs induced an increase in LPO in gills of tilapia fish (Oreochromis mossambicus) after 14 days of exposure with mean LPO of 5.833±0.208 nmol/mg (LPO level of control was 1.5333±0.1528 nmol/mg) [34].
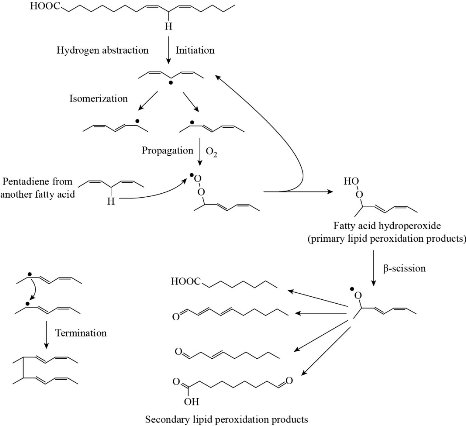
Fig. 15 Lipid peroxidation reaction [58].
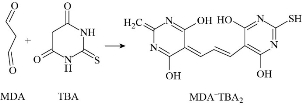
Fig. 16 Reaction between TBA and MDA to form pink complex of MDA-TBA2.
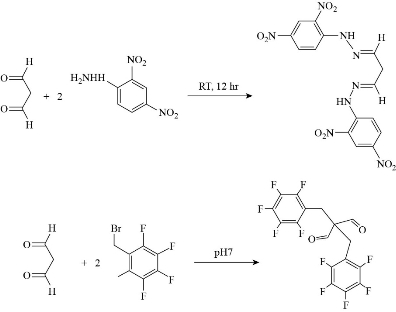
Fig. 17 Reaction of MDA with 2,4-dinitrophenyl hydrazine and PFB.
Lysosomal Membrane Permeability (LMP)
Lysosomal membrane is a single membrane which has an acidic (pH~ 4–5) environment maintained by ATP-dependent proton pumps present in the lysosomal membrane. LMP is defined as any damage to the lysosomal membrane that results in the release of lysosomal content into the cytosol [62], Endosomal Sorting Complex Required for Transport (ESCRT) assay is recently used for detection of small lysosomal membrane break, this small break of the lysosomal membrane allows small pH gradient to pass but not higher molecular weight materials such as galectins. Thus, when dextrane (higher molecular weight) are loaded to the endolysosomers conjugated to pH -sensitive dye such as florescence isothiocyante (FITC), an increase in fluorescence is noticed which indicates dispersion of pH gradient inside the intact lysosomes [62]. Treating hepetic cells (Alexander, Huh7 and HepG2) with different shapes of iron oxide NPs (cluster and cubic) induced LMP leading to the formation of large swollen of lysosomal membrane and consequently cell death. Cluster iron oxide induced higher LMP in comparison with cubic iron oxide in Alexander and Huh7 cells, whereas cubic and cluster iron oxide treatment showed no significant difference in extent of LMP in HepG2 cells [63]. Translocation of Lysosomal Enzymes by translocation of cathepsin D (CTSD) to cytosol can be visualized by using pepstatin A BODIPY FL probe. Pepstatin A is an isovaleryl-L-valyl-L-valyl-4-amino-3-hydroxy-6-methylheptanoyl-L-alanyl-4-amino-3-hydroxy-6-methylheptanoic acid and BODIPY FL is Boron dipyrromethene difluoride, see Fig. 18 [64]. BODIPY FL–pepstatin A stained lysosomes, where it co-localized with cathepsin D. This staining was depleted when cells are under oxidative stress environment.
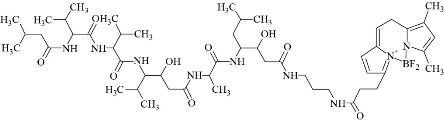
Fig. 18 Structure of pepstatin A BODIPY FL fluorescence probe.
Conclusions
The current review and previously published studies show that nanoparticles induce a wide range of toxic effects when applied to various types of organisms and cell lines. These effects range from weak to sever disorders that may lead to cancer or cell death and this can be attributed to many factors related to the nanoparticles or to the tested organisms and cells. The studies show that the physiochemical properties of the nanoparticles including size, shape, surface area, chemical composition and surface structure and coating can influence their biological and toxic effects. Toxicity of metal and metal oxide nanoparticles was extensively studied and was proven that these nanoparticles induce the generation of ROS resulting in oxidative stress. Various screening methods were developed to study the toxic effects of diverse NPs and the most common ones are measuring the level of ROS, DNA breakage, and LPO. The privilege of these tests is that they are not associated with specific type of enzyme as in cases of CAT, SOD and GSH. These enzymes are influenced by many internal and external factors that may give uncertain results. Detection of toxicity using spectrophotometry was the most used technique in the reviewed tests. However, these tests were time consuming as some of them needed days to study the gradual toxicological effect of the tested samples. Several toxicity assays are usually performed to confirm the biological and toxic effects of the tested nanoparticles. In addition, many studies indicated that metal and metal oxide nanoparticles have significant effects on normal cells and living organisms that may lead to cell death. Therefore, great efforts are required to reduce the risk of these nanoparticles in particular during manufacturing, usage and disposal. In addition, in terms of medical purposes, the design of selective nanoparticles that target cancer or infected cells without damaging normal cells is crucial.
Acknowledgments
Many thanks to Dr. Sherif Abdul Ghani for his comments and suggestions. This work did not require specific funding.
Conflict of Interests
The author declares no conflict of interest.
References
1. T. G. Iversen, T. Skotland, K. Sandvig, Endocytosis and intracellular transport of nanoparticles: Present knowledge and need for future studies. Nano Today, 2011, 6: 176-185.
2. J. Voigt, J. Christensen, V. P. Shastri, Differential uptake of nanoparticles by endothelial cells through polyelectrolytes with affinity for caveolae. PNAS, 2014, 111 (8): 2942-2947.
3. A. Verma, F. Stellacci, Effect of surface properties on nanoparticle-cell interactions. Small, 2012, 6 (1): 12-21.
4. M. P. Grzelczak, S. P. Danks, R. C. Klipp, et al., Ion Transport across Biological Membranes by Carborane-Capped Gold Nanoparticles. ACS Nano, 2017, 11: 12492-12499.
5. D. A. Kuhn, D. Vanhecke, B. Michen, et al., Different endocytotic uptake mechanisms for nanoparticles in epithelial cells and macrophages. Beilstein J. Nanotechnol, 2014, 5: 1625-1636.
6. H. Hillaireau, P. Couvreur, Nanocarriers’ entry into the cell: relevance to drug delivery. Cell. Mol. Life Sci, 2009, 66: 2873-2896.
Copyright© Suad Ahmed Rashdan . This is an open-access article distributed under the terms of the Creative Commons Attribution License, which permits unrestricted use, distribution, and reproduction in any medium, provided the original author and source are credited.

|
Nano Biomedicine and Engineering. Copyright © Shanghai Jiao Tong University Press |
 |