Enhancement in NO2 and H2-Sensing Performance of CuxO/TiO2 Nanotubes Arrays Sensors Prepared by Electrodeposition Synthesis
Araa Mebdir Holi 1 *, Ghufran Abd AL-Sajad 1, Asla Abdullah Al-Zahrani 2, Asmaa Soheil Najm 3
1 Department of Physics, College of Education, University of Al-Qadisiyah, Al- Diwaniyah, Al-Qadisiyah 58002, Iraq.
2 Imam Abdulrahman bin Faisal University, Eastern Region, Dammam, Kingdom of Saudi.
3 Department of Electrical Electronic & Systems Engineering, Faculty of Engineering and Built Environment, Universiti Kebangsaan Malaysia, 43600 UKM Bangi, Selangor, Malaysia.
* Corresponding author. E-mail: araa.holi@qu.edu.iq
Received: Jan. 27, 2021; Accepted: Dec. 2, 2021; Published: Feb. 5, 2022
Citation: Araa Mebdir Holi, Ghufran Abd AL-Sajada, Asla Abdullah Al-Zahranib, and Asmaa Soheil Najm, Enhancement in NO2 and H2-Sensing Performance of CuxO/TiO2 Nanotubes Arrays Sensors prepared by Electrodeposition Synthesis. Nano Biomed. Eng., 2021, 14(1): 7-14.
DOI: 10.5101/nbe.v14i1.p7-14.
Abstract
The CuxO/TiO2 nanotubes arrays are fabricated in two stages. Firstly, TiO2-NTs are grown by the Ti-foil anodization process and then annealed for 2h at 500 oC. Subsequently, CuxO thin film was deposited with different deposition times on the nanotubes by electrochemical cathodic reaction, then heated twice, once at 200 oC in the air and then at 300 oC in the closed furnace for 2 h, respectively. Pure-TNT and CuxO/TNTs heterostructure are characterized by XRD, FE-SEM, EDX, Hall effect, and as a gas sensor. Results show that the gas sensor (CuOx=1 /TiO2 for NO2 and H2 gases) prepared at the time (1 min) is higher than the pure TiO2-NTs and also higher than Cux=2O/TiO2 which were synthesized at various times 3, 5, 7, and 10 mins.
Keywords: CuxO /TiO2 heterostructure, Gas sensor, Nanotube arrays, Electrochemical deposition
Introduction
Metal oxide (MOx)-semiconductors are preferred materials to fabricate gas sensors due to their exceptional physical and chemical properties, low cost, and simple methods of preparation [1]. TiO2 is one of the most commonly used n-type semiconductors among those MOx materials [2]. Thereby TiO2 nanotubes can be widely applied in gas sensors [3], photoelectric devices [4], photocatalytic degradation of pollutants [5], water photolysis [6]. Due to the high surface/volume ratio, expansion of the surface charge area, good chemical and thermal stability, fast response and recovery times as gas sensors, TiO2 nanostructures have been widely studied in the field of gas sensors over the past decades [7-9]. Nanostructures of 1D TiO2 have been reported as a promising sensing material against H2 [10], ethanol [11], acetone [12], CO [13], and NO2 [14]. Because of the strong demand for better sensor properties for nearly all sensor applications, sensor technology work aims to achieve a high gas response, quick response and recovery times, and excellent selectivity sensing property, which are critical sensor parameters that need to be optimized for realistic applications [15]. Many attempts were made to integrate another material into the nanostructures of TiO2. As well known, nanometallic oxides structures, for example, consisting of WO3 [16], SnO2 [17], CuO [18], and ZnO [19] are used to form p-n or n-n junctions at the TiO2 interface to change the band around the band, currently it turned out to be very suitable [20]. Cupric oxide or cuprite (Cu2O), and cupric oxide or tenorite (CuO) are two common types of copper oxide [21]. CuO (monoclinic) and Cu2O (cubic) are p-type semiconductors with a bandgap between (1.0-2.1 and 2.0-2.6) eV [22] respectively, but CuO and Cu2O also have n- conductivity of type [23-24]. Since both materials complement each other in terms of their properties, several works have combined CuO, Cu2O, and TiO2 to form a new structure, TiO2/CuO, Cu2O, or in reverse. This research is concord on the combination of n-n type semiconductor materials to obtain better sensor output. CuxO/TiO2 nanotubes (n-n) type heterostructure sensors were manufactured to investigate the effect of (n-n) type heterostructure on the sensing of NO2 and H2 gasses. The TiO2 NTs were synthesized directly on Ti foil using the anodization method. Then, CuxO was manufactured as n-type metaloxide by electrochemical deposition on TiO2 NTs based on deposition time. Samples were exposed to various concentrations of NO2 and H2 gases at a temperature (27 oC) to investigate the sensing efficiency of the heterostructure. This is the first paper, to the best of our knowledge, on NO2 and H2 gas sensing by CuxO/ TiO2 (n-n) type heterostructure which was prepared by an electrochemical method based on deposition time.
Experimental
Synthesis
Composite of CuxO/ TiO2 was synthesized using the following steps. In the first step, the electrochemical anodization was performed in a cell of two electrodes with the Ti foil as anode and the graphite rod as a cathode. Commercially pure titanium samples (99.999%) had dimensions (1.0 x 2.5) cm, followed by degreasing with ultrasonic treatment subsequently in acetone, isopropanol, and deionized DI water for 15 minutes, followed by chemical etching in 6 M HNO3 for 10 minutes to give a fresh, smooth surface. They are then rinsed with extra deionized water and then air-dried. Both electrodes were attached to a power supply and were submerged in electrolytes consisting of 95 ml of anhydrous ethylene glycol, 5 ml of DI water, and 0.5 g of NH4F at 40 V for 1 h. In the air atmosphere, a thermocline furnace was used to anneal the films at 500 oC with a heating rate of 2 oC/min for 2 h. In the second step, the CuxO layer on top of TiO2 NTs via electrochemical deposition was synthesized in a two-electrode cell with the TiO2 nanotube/Ti foil as the cathode and the graphite rod as the anode. At 2 cm the distance between two electrodes was conserved. The two electrodes were connected to a power supply and they were immersed in an electrolyte consisted of anhydrous copper acetate aqueous solution (0.1 M) at 4V for 1, 3, 5, 7, and 10 min. As- prepared samples were rinsed with DI water. The samples were placed on a hot plate in the air at 200 °C for 2h and next annealed at the temperature of 300 °C for 2 hours.
Characterization
X-ray diffraction (Shimadzu 6000 diffractometer) studied the structure and phases of the samples using CuKα radiation at 40 kV and 40 mA. Surface morphology and elemental analysis of pure TiO2 nanotubes and CuxO/TiO2 nanotubes were tested at different time deposition using SUPRA 55 VP field emission scanning electron microscope (FE-SEM) to determine film thickness, grain size, surface morphology, and cross-sectional view with 10–20 kV accelerating voltage, which is fitted with energy dispersive-ray (EDX) detectors. HMS ECOPIA 3000 (magnetic field 0.57 T, probe current 10 mA) was used to measure the electrical parameters, including carrier concentration, mobility, and resistivity.
Gas sensing measurements
The sensing measurements as illustrated in Scheme 1, were performed using two platinum pads as electrodes in the (50–300) oC temperature range. The sensing item was put in a customized chamber type of flow. The current was measured using a Keithley 6517A Electrometer/High Resistance Meter. The sensor temperature was monitored with a Lakeshore 340 temperature controller during the measurements. The test chamber was first purged at a steady flow rate of 100-300 ppm with high purity dry air before the current entered its stable state. The desired concentration of H2 was obtained through a mass flow controller from the H2 tube. For NO2 tests a micro-syringe, containing diluted NO2 gas was used.
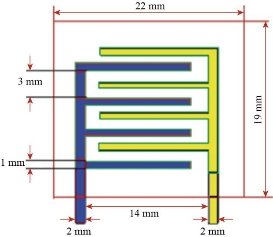
Scheme 1 Schematic description of the geometry of the electrodes.
Results and Discussion
Structural Characterization
XRD analysis
Fig. 1 shows XRD patterns of the TiO2 nanotubes arrays (TNTAs) and CuxO/TiO2 composite prepared at various time values scanned in the 2θ range from 20° to 70°. The peaks detected at values of 2θ correspondingly to the lattice plane as shown in Table 1. All the peaks are matched with standard indexed as tetragonal TiO2 anatase phases (JCPDS card no 021-1272) and TiO2 rutile phases (JCPDS card no 021-1276) is shown in Fig. 1 TNT, while Cux=1 O and Cux=2 O thin films deposited via electrodeposition technique has a monoclinic and cubic structure, respectively. Cux=1 O and Cux=2 O indexed (JCPDS card no. 045-0937) and (ICSD card no.065-3288), respectively. Results show that diffraction highest peaks locating at 25.2583°, 35.549°, 36.4732°, 36.4534°,36.6446° and 36.5465° could be observed in samples TiO2 TNT, CuO-1min and Cu2O-3 min,5 min,7 min and, 10 min attributing to the (101), (0 0 2), (1 1 1), (1 1 1), (111) and (1 1 1) planes, respectively. When the depositing time increased from 1 min to 10 min, the intensity of the peaks increased and became sharper, this increment was obtained caused by a decrease in the crystallite size from 25.9 to 17.0 nm according to Debye-Scherer's formula: D = 0.9λ / β cos θ.
Table 1. XRD analysis for CuxO/TiO2 TNT
|
[h k l] |
dhkl Std. (Å) |
Crys. size (nm) |
dhkl exp. (Å) |
FWHM (Å) |
2Ɵo
|
Deposition time |
|
[1 0 1] |
3.52000 |
25.9 |
3.523532674 |
0.3149 |
25.2583 |
(TiO2) A |
|
[0 0 2] |
2.52700 |
26.5 |
2.523582764 |
0.3149 |
35.5490 |
CuO-1 min |
|
[1 1 1] |
2.45951 |
28.3 |
2.461727887 |
0.2952 |
36.4732 |
Cu2O-3 min |
|
[1 1 1] |
2.45951 |
22.4 |
2.463019595 |
0.3739 |
36.4534 |
Cu2O-5 min |
|
[1 1 1] |
2.45951 |
19.3 |
3.011903952 |
0.4330 |
36.6446 |
Cu2O-7 min |
|
[1 1 1] |
2.45951 |
17.0 |
3.013225827 |
0.4920 |
36.5465 |
Cu2O-10 min |
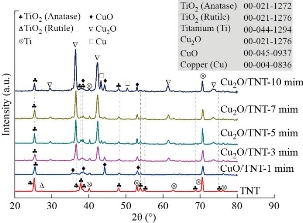
Fig. 1 XRD patterns TiO2 TNT, CuO-1 min /TNT, Cu2O-3 min /TNT, Cu2O-5 min /TNT, Cu2O-7 min /TNT, and Cu2O-10 min/TNT.
Morphological and EDS analysis
After 60 minutes of anodization time in prepared electrolyte for Ti foil, Fig. 2(a) shows a FESEM image of pure TNTs, the surface was very filled with self-organized and well-ordered TiO2 NTAs. The tube diameter of the samples was analyzed using image analysis software (Digimizer), the average diameter of pure TiO2 NTs is around 70±2 nm. Fig. 2(b) shows the cross-sectional image that the tubes are very smooth and aligned with the length of pure TiO2 nanotube ~2100 ±50 nm. The FESEM image of the CuO/TiO2 NTs with deposition time (1min) is shown in Fig. 2(c). The addition of CuO results in a lower diameter of 50±1 nm and reduces the aspect ratio of CuO/TNT composite tubes. The thin film CuO can be seen growing on the surface of the TNT arrays and it is apparent from the cross-sectional image view shown in Fig. 2(d) that the entire TNT including the top, inner and outer walls of the TNTs are covered in a thin film CuO with length nanotube 2400 ±40 nm. Fig. 3 shows the EDX spectrum that demonstrated the presence of titanium, copper, and oxygen elements.
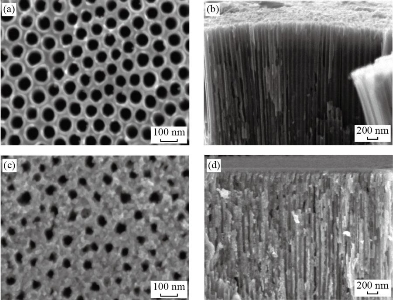
Fig. 2 FE-SEM images of the TiO2 TNT: (a) Top view, (b) cross-sectional, and CuO-1 min/TiO2 TNTAs: (c) Top view, (d) cross-sectional.
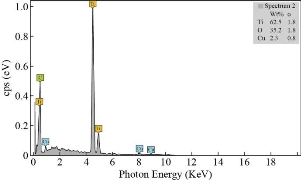
Fig. 3 The EDX spectrum of CuO-1 min/TiO2 NTs.
Electrical properties
Hall effect can be used to determine important parameters of the material through measurements. However, the voltage from Hall is the most important (VH). The measurement of Hall voltage yields key characteristics such as carrier mobility (μ), carrier concentration (n), Hall coefficient (RH), resistivity (μ), and type of conductivity (n or p). The results obtained from the Hall effect indicated that the pure TiO2 NTs and CuxO/TiO2 NTs have a negative Hall coefficient (n-type). With pure TNT, conductive TiO2 typically has carrier concentration (-4.5×10¹⁹) cm-3 is higher than the reported value of electron concentration of the bare titania nanotubes that was (-1.55 × 1016 cm−3) [25]. In literature, CuO is reported to be n-type [26-23], and sometimes p-type [9-20]. Fig. 4 shows that the carrier concentration of the composite samples CuxO/TNT is lower than pure TNT that means the companies CuxO with TNT increase the oxygen vacancies so the number of n decrees but still n-type conductivity because of the thickness of the CuxO layer and the compensation effects. As known, electrons concentration determines the n-type of conductivity. It was demonstrated from Hall measurement that the n-type conductivity behavior of CuxO thin films may be due to the existence of oxygen vacancies as reported by [27-30], they also used the electrodeposition method. Moreover, many researchers such as Jayakody, W. Siripala & Kumara, W. P. Siripala, and Wijesundera et al., concluded that n-type Cu2O thin films can be synthesized on conducting substrates using the electrodeposition method [31-34]. They reported that the origin of this n-type behavior of the electrodeposited films is due to oxygen vacancies and/or additional copper atoms, and indicated that it is a consequence of strong Cu2O absorption of an unstable surface state defective on copper formed over the p-Cu2O surface, leading to an inversion layer that shows n-type conduction behavior [35-36]. The composite of metal-oxide- metal oxide (n-n heterostructure) has a large number of defects at the heterojunction interface that may affect the type of conductivity [37]. Then, the n value increases with the increase of CuO content such behavior is expected as a result of the substitution of CuO creating one extra free carrier in the process. As the time of the deposition is increased, more aggregations occur. Thus, the resistivity increases with increasing of CuxO content, Fig. 5. In contrast with the Hall mobility as shown in Fig. 5, it is decreased with increasing of thickness of CuxO. The decrease in mobility has come from the inverse relation between μH and n. This is typical of many polycrystalline thin films and is due to the existence of potential barriers in the grain boundaries [26].
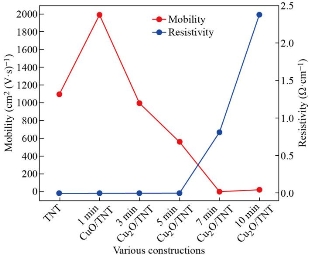
Fig. 4 Carrier concentration values of various constructions.
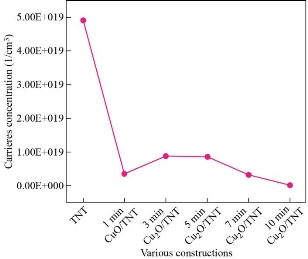
Fig. 5 Mobility and resistivity values of various constructions.
Sensing properties
The response times of the CuxO decorated TiO2 nanotube (NO2 and H2 gases) were less compared to the bare TNT sensor that can be seen in Fig. 6(a) and (b). The response times calculated for CuO-1 min / TNT sensor at (100-300) ppm of NO2 and (100-250) ppm of H2 at ambient temperature had improved, can be attributed to the formation of multiple (n-n) junctions at the CuO and TiO2 interfaces. Although the heterojunction sensor's response time was increased the recovery time for both the sensors (pure sensor and heterojunction sensor) remained lower than the response times as observed in Fig. 6(c) and (d). This may be due to the low desorption rate of NO2 and H2 at room temperature (27 oC) [38-40]. Fig. 7(a) demonstrates the difference in sensor responses to 100 ppm of NO2 and H2 gas concentration for a period of 1min of the pure TiO2 nanotubes as a function of operating temperature from (50-300) oC. The TiO2 nanotubes show a gradual rise in gas response and reached maximum value for NO2 and H2 gasses at 150 oC before decreasing. The gas response of TiO2 towards NO2 and H2 was decreased at operating temperatures above 150 oC. The reduction of gas exposure at higher temperatures is due to the reduction of the adsorbed NO2 and H2 gasses on the TiO2 surface [10]; [41-42]. Fig.7(b) shows that the relatively high response of CuO-1 min / TiO2 to H2 can be attributed to the unique hierarchical morphology of nanotubes decorated with CuO nanoparticles, which promotes the adsorption of hydrogen and oxygen surface reaction [10, 43]. Mostly on the thin film surface, H2 molecules are adsorbed as protons and then desorbed as water vapor [44], and re-interact as hydroxyl ions with the surface. As known, when the sensor is under the reducing gas effect, the electrons obtained from the chemical reaction in the adsorbed oxygen ion forming process are given back to the conduction band. Since reduced gas acts as electron donors when interacting with the metal oxide surface, the gas desorbs or eliminates chemisorbed oxygen ions and physisorbed hydroxyl ions from the metal oxide surface during this interaction. In addition, the improved H2 response of CuO-1 min/TiO2 can result from the complementary contributions based on two factors. First, the enhanced adsorption of O2 due to the TNT decoration Cux=1O shown by XRD in Fig. 1 and FESEM image Fig. 2(b) and (c) proposed a generation of more active material surface sites, which would support the gas-surface reactions. Secondly, the nanocomposite CuxO/TiO2 NTs will be indeed n-n heterojunctions. Previous work has shown that TiO2 (~2.3 eV) has a greater bandgap than Cux=1O (~2.17 eV); [45] and both conductive (C.B) and valance (V.B) bands of TNT are higher than Cux=1O, resulting in the transfer of electrons from the TiO2 conductive band to Cux=1O [46-47]. Platinum electrode is another element that can play a role in the sensitivity to hydrogen. Platinum can act as a catalyst for the hydrogen-titania interaction. Hydrogen dissociation on platinum surfaces can occur at elevated temperatures [10]. Results of the gas sensing test indicate that the Cux=1O loading achieved a significantly greater response better to H2 as well as shorter response time. Whereas, the CuO-1 min/TiO2 sensor displayed a response as high as 49% to 100 ppm H2 at 100 oC while pure TNT was 35% at 150 oC. The efficient gas-sensing performance of the composite CuO / TiO2 can mostly be caused by the very well-organized nanotubes morphology with heterojunction formation at the Cux=1O and TiO2 interfaces. Fig. 7(b) also shows the CuO-1 min/TiO2 response of NO2 gas at 100 ppm concentration for different operating temperatures. The CuO-1 min/TiO2 sensor exhibited a response as high as 40% toward 100-ppm NO2 at 250 oC however as pure TNT 25% at 150 oC. The NO2 gas interacts with the surface of a CuO-1 min/TiO2 through surface-adsorbed NO2 ions, which affects the number of charge carriers in the area adjacent to the surface, thus increasing the potential barrier at grain boundaries [3]. As the heterostructured CuO-1 min/TiO2 has oxygen vacancies more than pure TiO2 NTs that caused an increase in sensor response. The growing resistance informs us that this sensor layer is getting impoverished in the number of electrons, in resent of which the adsorbed gas molecules are forming traps localized in the forbidden band of the semiconductor. The interface at a p – n junction has far fewer free electrons, while at an interface of n-n junction simply moves electrons into the lower-energy conductive band, creating an "accumulation layer" in the Cux=1O rather than a depletion layer in TiO2 NTs, as shown in Scheme 2. The accumulation layer may be depleted by subsequent gas adsorption on the Cux=1O surface, further enhancing the potential energy barrier at the interface, and improving the response. The effect of heterojunction on gas sensing properties has been studied in the literature. Alev et al. studied sensing properties of copper oxide thin film/TiO2 nanotubes heterojunction composite [18]. They reported that the improved H2 performance of the sensor can be attributed to the heterojunction. Moreover, CuO/TiO2 heterostructures were synthesized by Rydosz et al. for gas sensing applications [20]. They found that doping CuO into TiO2 affects sensor performance and that the sensors are sensitive to NO2 and H2.
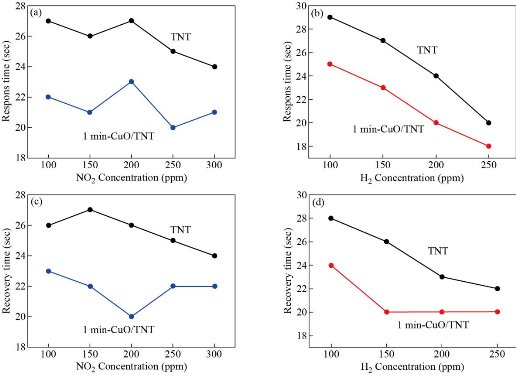
Fig. 6 Response and recovery times of the pure TiO2 nanotubes and CuO-1 min/TiO2 NTs heterojunction sensor calculated for (a) NO2 and (b) H2 at different concentrations at room temperature (27 oC).
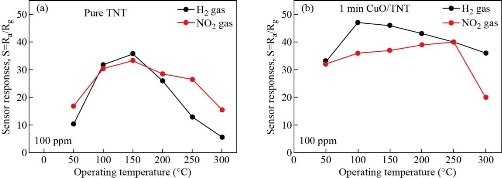
Fig. 7 Sensor responses of the device upon exposure to 100 ppm H2 and NO2 at different operating temperatures: (a) Pure TiO2 NTs; (b) CuO -1 min/TNT.
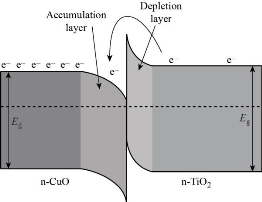
Scheme 2 Schematic illustration of the energy band structure at heterojunction interface of n-n type.
Conclusions
An anodization method was used to synthesize strongly ordered TiO2 nanotube arrays. The nanotubes were decorated with CuxO nanoparticles using the electrodeposition process. Results of the gas sensing test indicate that CuO-1 min loading achieved a significantly larger response to H2 and NO2 as well as a shorter response time. The CuO-1 min/TiO2 sensor showed a response as high as 49 % to 100 ppm H2 at 100 ◦C and 40 % to 250 ◦C. NO2 at 100 ppm. The excellent efficiency of the nanocomposite of gas detection can be attributed primarily to the highly ordered nanotube morphology and heterojunction at the CuO-1 min / TiO2 interface. This paper provides the possibility of study the oxidizing and reducing gases by monitoring the response and recovery time at the different concentrations of both NO2 and H2 gasses and operating temperature at fixed concentration 100 ppm of NO2 and H2 gases for 1 minute, although further studies on these effects we are needed more investigated.
Acknowledgments
The research work presented here is supported by the University of Al-Qadisiyah, Iraq, and Imam Abdulrahman bin Faisal University, Saudi Arabia.
Conflict of Interests
The authors declare that no competing interest exists.
References
Copyright© Araa Mebdir Holi, Ghufran Abd AL-Sajada, Asla Abdullah Al-Zahranib, and Asmaa Soheil Najm. This is an open-access article distributed under the terms of the Creative Commons Attribution License, which permits unrestricted use, distribution, and reproduction in any medium, provided the original author and source are credited.

|
Nano Biomedicine and Engineering. Copyright © Shanghai Jiao Tong University Press |
 |