Research Article
Fabrication and Characterization of the PMMA/G/Ag Nanocomposite by Pulsed Laser Ablation (PLAL)
Musaab Khudhur Mohammed 1 *, Ghaleb Al-Dahash 2, Amer Al-Nafiey 2 *
1 University of Babylon, College of Education for Pure Sciences, Department of Physics, Hillah, 51001, Iraq.
2 University of Babylon, College of science for women, Department of Laser Physics, Hillah, 51001, Iraq.
* Corresponding author: pure.musaab.kh@uobabylon.edu.iq; amer76z@yahoo.com
Received: Oct. 5, 2021; Accepted: Apr. 21, 2022; Published: Apr. 21, 2022
Citation: Musaab Khudhur Mohammed, Ghaleb Al-Dahash, and Amer Al-Nafiey, Fabrication and Characterization of the PMMA/G/Ag Nanocomposite by Pulsed Laser Ablation (PLAL). Nano Biomed. Eng., 2022, 14(1): 15-22.
DOI: 10.5101/nbe.v14i1.p15-22.
Abstract
In this work, By using the laser ablation technique (PLAL) to fabricate novel PMMA/G/Ag nanocomposites with less laser energy and short time ablation and study the structural, morphological and optical properties. The X-ray diffraction (XRD) confirmed that the GNPs and AgNPs in the PMMA matrix have a crystallite size increased with increasing the pulse number. Also, the SEM images confirm the homogeneous distribution of the GNPs and AgNPs in the PMMA matrix and the sizes of particles in the nanoscale. Additionally, the link between GNPs and AgNPs in the polymer matrix has been confirmed by the FTIR. Moreover, UV-VIS spectroscopy was studied and confirm the nanocomposite has optical properties with the presence of the polymer as a host and calculating the optical energy gap. For that, this novel nanocomposite with these properties promising for many applications. Finally, the study proved that the PLAL is very suitable for decorated graphene and metal on the polymer matrix with lower pulse laser energy and short ablation time.
Keyword: PLAL, Graphene, Silver, Polymer, Nanocomposite, Characterization, Properties
Introduction
Graphene is a 2D dimensional Hexagonal lattice made up of a single sheet of carbon atoms tightly packed together [1]. Due to its unique electrical, optical, and mechanical properties, graphene is attracting increasing interest from a variety of research fields. It is a zero-band gap semiconductor that is not expected to be photoactive or photo luminescent. Other important features include a high optical transmittance (97.3%) [2-7]. As a result of the discovery of graphene, Geim A. K. and et. al. were awarded the Nobel Prize in Physics in 2010 [8]. Mechanical exfoliation [9], graphite intercalation [10], epitaxial growth of silicon carbide pyrolysis [11], an electrochemical technique [12], reduction of oxidized graphite [13], and chemical vapor deposition CVD [14] are some of the methods used to make graphene. These techniques, which include multiple steps and the use of strong reducing agents, are not environmentally friendly. On the other hand, pulsed laser ablation in liquid (PLAL) is another method for producing graphene due to its cleanliness, simplicity, ease of particle synthesis at the nanoscale, and strong tools for controlling the final production of the laser ablation process[15-18]. Besides, an important way to purify the particle size produced in this way is to use the newest method as in the [19]. A few polymers can be extended essentially by homogeneously joining graphene due to their low Young's modulus, making polymer/graphene nanocomposites appealing for a variety of applications. Polymer-graphene nanocomposites, such as poly(methyl methacrylate (PMMA) prepared by a simple casting method [20] and graphene/polyvinyl alcohol (PVA) nanocomposite films, have been fabricated using various techniques such as a facial aqueous solution [21], simple solution method [22], and solution cast method [23]. While many achievements have been made, such as graphene and various metallic nanoparticle like silver (Ag) [24, 25], copper (Cu) [26], and gold (Au) [27]. In this article, we propose a new method for the production of nanocomposites PMMA/G/Ag by PLAL technique with lower pulse laser energy and short ablation time.
Experimental
Table 1 The concentration of the GNPs, Ag NPs and thickness for all the prepared films
|
Symbol |
Nanocomposites |
Concentrations |
Film thickness (μm) |
|
- |
PMMA |
|
1.06 |
|
S1 |
PMMA/(G100p) |
G=20 ppm/10 ml |
1.46 |
|
S2 |
PMMA/G(100p)/Ag(400p)
|
G=24 ppm/10 ml Ag= 32 ppm/10 ml |
1.48 |
|
S3 |
PMMA/G(200p)/Ag (500p)
|
G=34 ppm/10 ml Ag= 57 ppm/10 ml |
1.66 |
|
S4 |
PMMA/G(300p)/Ag(600p)
|
G=77 ppm/10 ml Ag= 83 ppm/10 ml |
1.78 |
|
S5 |
PMMA/G(400p)/Ag(700p)
|
G=87 ppm/10 ml Ag= 97 ppm/10 ml |
1.83 |
To obtain information about the atomic structure of the materials, Philips PW X-ray diffraction technique (XRD-6000-SHIMADZU) with Cu-Ka radiation source at 2θ = (0–80) degree. To investigate the morphology of prepared samples, Hitachi S4160 was used in scanning electron microscopy (SEM). To obtain the structural characterizations of the prepared nanocomposite, FTIR spectroscopy (Shimadzu, IRAffinity-1, Japan) in the 500-4000 cm-1). To investigate the UV–Visible used (Shimadzu UV- 1650 PC) made by Phillips, (Japanese company) for the wavelength range from 200 to 900 nm. To record the spectra, samples were in 10 mm path length quartz cells with reference to correspond solution.
Results and Discussion
XRD pattern for all the films prepared as shown in (Figures 2, 3). It can be seen that the peaks of pure PMMA around 2θ= 14.89° corresponding to the polymer’s crystalline phase pure PMMA [28] and the GNPs around 2θ=26.62o for film S1 and 26.34o for S2, S3, S4, S5 corresponding to the miller indices (002) which is comparable with literature data (JCDPS 89-7213) [29] confirming the presence of the hexagonal graphene structure. Also from this figure the AgNPs around 2θ= 35.06o, 41.63o, 63.25o, and 77.14o corresponding to the miller indices (111), (200), (220) and (311) respectively were assigned to face-centered cubic (JCPDS File no. 89-3722).24) [30]. From XRD confirms the presence of the GNPs and AgNPs in the PMMA matrix. The crystallite size has been calculated from Scherer’s formula according to the equation (1) [31]:
D= 0,9λ/βcosθ, (1)
where (β) is the full width at the half of the maximum intensity (FWHM) (in radian), (θ) is the Bragg diffraction angle of the XRD peak (degree), and (λ) is the X-ray wavelength (Å).
It was found that the crystallite size and the intensity of all peaks increased with increasing of the number of pulses. The crystallite size increased from 12.91nm for film S1 to 27.76nm for S5. This result is in agreement with the previous studies [20, 32, 33, 34]. The lattice constant a, b and c were calculated by using equation (2) [31] and listed in Table 2.
![]() (2)
(2)
The surface morphology for all the prepared films of the nanocomposite could be observed by the SEM. Figure(4) explain SEM images for all the sample preparation, it is observed that the pure PMMA was homogenous and smooth this indicates a good method for prepared sample, also it is observed that the homogeneous dispersed of GNPs and AgNPs inside PMMA matrix respectively, primarily due to strong covalent interaction between the GNPs and AgNPs in the PMMA matrix [35] determined from FTIR analysis. However, from Table (3), we note that the average particle size increased with increasing of the number of pulses, it is increased from 25nm to 65nm in the PMMA matrix. This result attributed to the increasing concentration of the GNPs and AgNPs that was confinement by the dynamic light scattering and agreement with XRD spectra, which is importantly used in piezoelectric sensor and optoelectronic detector. This result agrees with the previous studies [20, 34]. The data about the compound holding in the newly created nanomaterials was shown using Fourier transform infrared (FTIR) spectroscopy. Figures (5,6) shows FTIR for the graphite powder and PMMA/G/Ag nanocomposite with the different number pulses at room temperature. In the graphite powder spectra, the peaks at (601, 832, 1086, 1240,1372,1713, 2911, and 3295) cm−1 clearly corresponds to various functionalities including represents bending of C-H, C–C stretching, C-O stretching, C-OH stretching, plane OH bending mode of hydroxyl groups, C=O stretching and O–H stretching vibration respectively observed [36, 37]. On the other hand, figure (5) shows the FTIR spectra of the PMMA/G/Ag nanocomposite and pure PMMA, the peaks (667) cm-1 that has been shifted to the higher wavenumber while the peaks (744, 1214, 3025) cm-1 that has been shifted to the lower wavenumber and the peaks (1372, 1086, 1713, 2911) cm-1 of the graphite spectra that disappeared in the PMMA/G/Ag nanocomposite and pure PMMA. A new peak has been observed at (1668) cm-1 due to C=C stretching [38, 39] for the PMMA/G/Ag nanocomposite and pure PMMA that was preferred for the graphene. As a result of the shift to the higher wavenumber side, the molecule's mass is reduced. Because the mass of a vibrating molecule is inversely proportional to its frequency of vibration. As a result, the lighter the molecule, the higher the vibration frequency and wave number. It is noted that the intensity of these peaks is increasing with the increasing of the number of the pulses that was attributed to the increasing of the concentration of the GNPs and AgNPs in the PMMA matrix that was confirmed by the dynamic light scattering and also due to indicating that C=O has been established. This result is in agreement with the previous studies [40]. Strong contact between the GNPs and AgNPs in the PMMA matrix confirmed good interfacial adhesion, which is an important criterion for the nanocomposite to be used as the piezoelectric sensor and optoelectronic detector. The absorption spectra as a function of the wavelength as shown in figure (7). This figure obtains that the absorption increased with increasing of the number pulses laser for all the films prepared, this result due to increase the concentration of the graphene and silver nanoparticle (GNPs, AgNPs) with increasing the number of the pulses laser was confirmed by the dynamic light scattering. Also, the figures show that the absorption peaks at 280nm in all the films of PMMA solvent. The absorption peak due to π–π* transition of C=C band and n– π* transition of C=O band have occurred around 280 nm of the GNPs. These absorption peaks are observed due to Surface Plasmon Resonance (SPR) in the free electron cloud of carbonaceous material π electrons. These absorption peaks a characteristic feature of graphene. This result agrees with the previous studies [41,42,43]. While the presence of AgNPs in the nanocomposite was confirmed by the absorption peak at 408nm for the PMMA solvent. This specific range shows the surface Plasmon effect of AgNPs. This confirms the formation and presence of AgNPs in the nanocomposite, due to the SPR of the AgNPs, which is similar to previous studies [32]. Also the main absorption peaks of the GNPs and AgNPs in PMMA solvent shift toward a longer wavelength (redshift) which is different from the position of the main peak of the GNPs and AgNPs in PMMA solvent that indicates the increased particle size and vice versa [44] which is confirmed by the (XRDM SEM and FTIR. By using equation (3) to calculate the optical energy gap (Eg) for all the samples prepared [45]:
αhν=(hν-Eg)r (3)
Fig. 8 and 9 show that the indirect optical energy gap for the allowed and forbidden transition electrons respectively for all the films prepared. To determine the (Eg) is to scheme a chart between (αhν) r and photon energy (hν) and where r is (1/2) or (1/3) for the allowed and forbidden indirect electron transition. Extrapolating the straight pieces of these relations to the hv axis yields the optical band hole estimations which are recorded in a table (4). From the figures, we note that the Eg decreased from 4.9 to 4.1 eV and 4.55 to 3.5 eV of the allowed and forbidden indirect energy gap with the increasing of the number of the pulses laser for the GNPs and AgNPs for the PMMA solvent. This result is attributed to the increasing concentration of the GNPs and Ag NPS that was proved by the dynamic light scattering. This result due to localized states of the various color centers may lead to a widening of the mobility gap. This overlap may prove to be a reduction in the energy gap when the concentration of GNPs and AgNPs in the PMMA solvent increases. This result agrees with the previous studies [46].
Table 2 The XRD results obtained for all the prepared films
|
Films |
2θ |
(hkl) |
FWHM (degree) |
a (Å) |
b (Å) |
c (Å) |
d (Å) |
Crystallite size (nm) |
Average Crystallite size (nm) |
|
S1 |
26.62 |
G (002) |
0.599 |
2.443 |
2.436 |
2.435 |
3.45 |
12.91 |
12.91 |
|
S2 |
26.34 35.06 41.63 63.25 77.14 |
G (002) Ag(111) Ag(200) Ag(220) Ag(311) |
0.477 0.419 0.674 0.546 0.405 |
2.438 2.344
|
1.918 2.344
|
1.917 2.344
|
3.46 2.34 2.12 2.22 2.32 |
16.23 18.09 11.03 12.40 15.36 |
15.79 |
|
S3 |
26.44 35.12 41.73 63.30 77.28 |
G (002) Ag(111) Ag(200) Ag(220) Ag(311) |
0.407 0.369 0.474 0.386 0.335 |
2.439 2.355
|
1.914 2.355
|
1.913 2.355
|
3.47 2.33 2.17 2.09 2.18 |
19.01 20.54 15.68 17.55 18.56 |
18.79 |
|
S4 |
26.54 35.26 41.86 63.40 77.34 |
G (002) Ag(111) Ag(200) Ag(220) Ag(311) |
0.377 0.339 0.314 0.346 0.305 |
2.446 2.318
|
1.916 2.318
|
1.917 2.318
|
3.45 2.35 2.26 2.18 2.33 |
20.52 22.35 23.67 19.56 20.38 |
20.45 |
|
S5 |
26.64 35.36 41.96 63.44 77.44 |
G (002) Ag(111) Ag(200) Ag(220) Ag(311) |
0.307 0.289 0.274 0.236 0.205 |
2.438 2.326
|
1.915 2.326
|
1.916 2.326
|
3.44 2.36 2.32 2.35 2.28 |
25.20 26.21 27.12 28.69 30.32 |
27.76 |
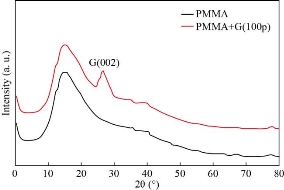
Fig. 2 The XRD spectrum of the pure PMMA and PMMA/G (100 p).
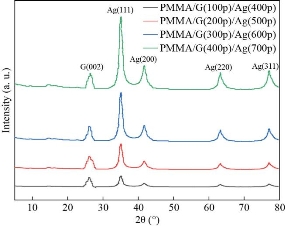
Fig. 3 The spectrum of XRD the PMMA/G/Ag nanocomposite with different pulses number.
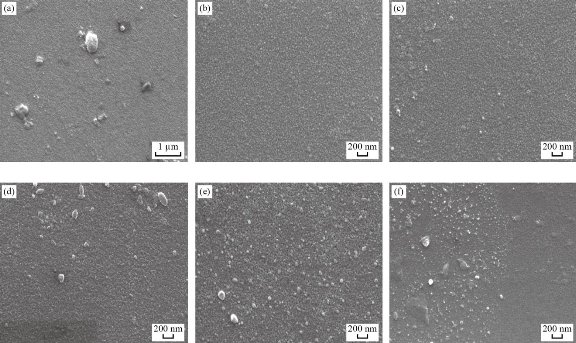
Fig. 4 SEM images for the (a) PMMA, (b) S1, (c) S2, (d) S3, (e) S4 and (f) S5.
![]() Table 3 The average particle size for all samples obtained from SEM results.
Table 3 The average particle size for all samples obtained from SEM results.
|
Films |
Average particle size (nm) |
|
S1 |
32 |
|
S2 |
54 |
|
S3 |
66 |
|
S4 |
71 |
|
S5 |
95 |
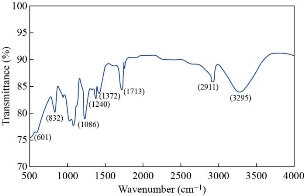
![]() Fig. 5 FTIR spectrum of the graphite powder.
Fig. 5 FTIR spectrum of the graphite powder.
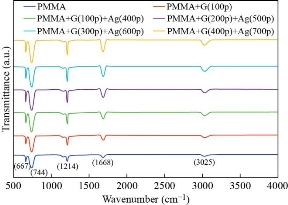
Fig. 6 FTIR spectrum for the PMMA, PMMA/G (100p) and PMMA/G/Ag nanocomposite with different laser pulses number.
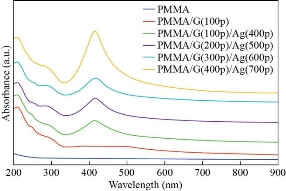
Fig. 7 The absorption spectra of the pure PMMA, and PMMA/G/Ag nanocomposite with different pulses.
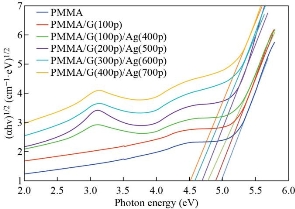
![]() Fig. 8 A plots of (αhν)1/2 versus photon energy (hν) of pure PMMA, PMMA/G(100p) and PMMA/G/Ag nanocomposite with different pulses.
Fig. 8 A plots of (αhν)1/2 versus photon energy (hν) of pure PMMA, PMMA/G(100p) and PMMA/G/Ag nanocomposite with different pulses.
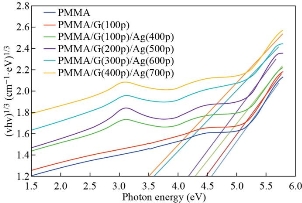
Fig. 9 A plots of (αhν)1/3 versus photon energy (hν) of pure PMMA, PMMA/G(100p) and PMMA/G/Ag nanocomposite with different pulses.
Table 4 The value of allowed and forbidden indirect energy gap for all samples prepared
|
Films |
Allowed Eg(eV) |
Forbidden Eg(eV) |
|
PMMA |
5 |
4.6 |
|
S1 |
4.9 |
4.5 |
|
S2 |
4.8 |
4.3 |
|
S3 |
4.7 |
4.2 |
|
S4 |
4.6 |
3.6 |
|
S5 |
4.5 |
3.5 |
Conclusions
In summary, the PLAL technique has been employed to manufacture PMMA/G/Ag nanocomposites for using less laser energy and short time ablation. The presence in the PMMA matrix of GNPs and AgNPs was confirmed by XRD and the crystallite size was increased as the number of pulses increased. In SEM images, the GNPs and AgNPs are shown in the PMMA matrix as a homogeneous distribution. The link between polymer network and GNPs, AgNPs have been shown by FTIR to be sufficient to have stable nanocomposite. Also studied was UV-VIS spectroscopy. In the PMMA solvent, the absorption peak for GNPs at 280 nm and for AgNPs at 408nm, and all nanocomposite have an indirect optical energy gap for the allowed and forbidden transition electron and with increasing concentration of GNPs and AgNPs in nanocomposite, the optical energy gap decreased for the allowed and forbidden transition electron. We have demonstrated a new method for producing and synthesizing such polymeric composites using laser ablation.
References
Copyright© Musaab Khudhur Mohammed, Ghaleb Al-Dahash, and Amer Al-Nafiey. This is an open-access article distributed under the terms of the Creative Commons Attribution License, which permits unrestricted use, distribution, and reproduction in any medium, provided the original author and source are credited.

|
Nano Biomedicine and Engineering. Copyright © Shanghai Jiao Tong University Press |
 |