
Article
Konjac Biomolecules Assisted–Rod/ Spherical Shaped Lead Nano Powder Synthesized by Electrolytic Process and Its Characterization Studies
T. Theivasanthi 1*, M. Alagar1
1Centre for Research and Post Graduate Department of Physics, Ayya Nada Janaki Ammal College, Sivakasi - 626124, Tamilnadu, India.
* Corresponding author: T. Theivasanthi (theivasanthi@pacrpoly.org) Tel/fax.: +91-9245175532
Citation: T. Theivasanthi and M. Alagar. Konjac biomolecules assisted–rod/spherical shaped lead nano powder synthesized by electrolytic process and its characterization Studies. Nano Biomed. Eng. 2013, 5(1), 11-19.
DOI: 10.5101/nbe.v5i1.p11-19.
Abstract
Synthesis and structural characterization of Pb nanoparticles by electrolysis using a bioactive compound-konjac aqueous extract is the main aim of this study. This method is a unique, novel, low cost and double-step procedure with good reproducibility and has not been used for nanoparticles preparation so far. Konjac extract has been added to prevent the oxidation of Pb nanoparticles. Also the synthesized nanoparticles have been dried in open air to observe their stability. Various types of characterization tools have been utilized to study characters of the end product. Anti-bacterial Studies has also been done. After completion of synthesis process that we have made an attempt to change the shape of the synthesized nanoparticles by the influence of sunbeams and to find the effects of the sunlight on nanomaterials.
Keywords: XRD, Lead nanopowder, Konjac, Electrolysis, Debye-Scherer
1 Introduction

Nanoparticles are being synthesized in various methods including electrolysis and many irradiation methods such as sonochemical [1], UV or vis photoirradiation [2], laser pulse [3] and γ-irradiation methods [4] and so forth. When nanomaterials interact with biological systems, their properties are changed significantly, affecting their functionality and behavior. While, on contact with a biological fluid they may become coated with proteins and other biomolecules. The potential interactions of nanoparticles with biological systems may also be desirable characters in sometimes. Solvent, pH value, photo-sensitizer, the concentration and category of stabilizer, irradiation intensity, wavelength, and irradiation time are all important factors that must be considered for shape and size controlled synthesis of metal nanoparticles [5]. In photochemical reduction, hydrated electrons or free organic radicals formed by photo-irradiation (e.g., by UV or visible light) reduces the metal ions to metals. The photolysis of phenols in aqueous solution produces hydrated electrons. Photo-initiators like phenolic compounds absorb light in the UV-visible region and form reactive intermediates such as free radicals [6]. Methanol is also a photoinitiator,used for such purpose [7]. These intermediates (or hydrated electrons) are serving as a reducing agent and prevents the oxidation of lead nanoparticles. From earlier reports, gold nanorods have been intensively affected by the wavelength of UV light source and their photon flux [8]; rod like gold particles have been prepared by UV irradiation; Metals have strongly absorb light in the visible region due to surface plasma resonance [9]; the number of surface amino group of dendrimers have a key factor to control the particles with UV irradiation method [10]; stabilization of metal nanoparticles by protein is possible one [11]; proteins can bind to nanoparticles either through free amine groups or cysteine residues in the proteins [12]; and via the electrostatic attraction of negatively charged carboxylate groups in enzymes present in the cell wall of bacteria [13]. Antioxidants are chemical substances that donate electron. The aqueous extract of A. campanulatus tuber has more significant antioxidant activity and more reducing power as compared to methanol extract [14]. 46.33 mg g-1 of flavonoidal content, 12.67 mg g-1 of phenolic contents and tannins are present in the air dried powder of A.campanulatus tubers [15]. Amorphophallus campanulatus (Roxb.) Blume. ex Decne (Synonym : Amorphophallus paeoniifolius; Araceae) commonly known as Konjac. The tubers contain an active enzyme amylase, amino acids, carbohydrates, saponin etc. Glucomannan is a polysaccharide (hemicelluloses) and a super absorbent present in konjac. Flying powder in konjac is a polyol (natural polymer) used in precipitation of soluble heavy metal ions in wastewater. Lead nanostructures are attractive materials for its potential applications in lead batteries, catalysis, superconductor and photonic crystal. Earlier study reports that hexagon and flower shaped lead oxide (PbO2) are the end product in electrolysis process (anodic oxidation of lead) using lead sheet as anode and distilled water [16]. It is known that Pb nanoparticles are highly reactive and transfer electron to N2O, O2, etc. [17]. While on synthesis of Pb nanoparticles, increasing the concentration of surfactant/stabilizing agent have produced Pb hollow nanoparticles and decreasing its concentration have produced solid Pb nanoparticles [18]. In this study, we will present preparation and structural characterization of Pb nanoparticles synthesized by electrolysis using a bioactive compound-konjac aqueous extract as stabilizing agent to prevent from oxidation. Our method is a unique, novel and double-step procedure with good reproducibility. To our knowledge, such a procedure has so far not been used for nanoparticles preparation. Also, we have made an attempt to find the effects of the sunlight on nanomaterials and got morphologically changed-rod like Pb nanoparticles. It explicates that the sunlight can be utilized for dual function i.e. as a dryer for the synthesized materials and as a morphological changer. We found the shape of the konjac extract added Pb nanoparticles changed to rod shape by the influence of sunbeams. It is pertinent to note that we have made these morphological changes after completion of the entire synthesis process. Avoiding oxidation is the main challengeable task while on metal nanoparticles preparation particularly in Pb nanoparticles synthesis. Drying Pb nanoparticles in open air and sunlight indicates that this task is defeated/achieved by adding konjac extract.
2 Experimental Method
The experiment was performed in an electrochemical bath (volume: 4 × 3 × 3 cm3) with two electrode set up. High purity lead rod was utilized as working electrode (anode), stainless steel rod as counter electrode (cathode) and 3 cm distance was kept between the electrodes. 5 g of Pb(NO3)2 salt was kept in a clean glass vessel. 100 mL of distilled water was poured in this vessel and stirred well until the lead nitrate salt was completely dissolved in the water (clear and colourless solution). This solution was transferred to the electrochemical bath and used as an electrolyte. A constant voltage of 15 V was applied between the electrodes using a power supply for a time span of 10 minutes. This process is shown in Figure 1. At the end of the process, deposition of Pb nanoparticles was observed and they were removed from the cathode and the Pb nanoparticles (settled down on the electrolytic cell) were also removed from the bath. The electrolyte Pb(NO3)2 is an oxidizing agent. The Pb nanoparticles are highly reactive material and they can be easily oxidized. So, the stabilization of lead nanoparticles is essential. For making konjac aqueous extract, 20 g of konjac tuber was sliced/cut into many pieces. These pieces were put in a vessel and a 100 mL of distilled water poured in it. This vessel was kept in a stove and boiled for 10 minutes. At the end, konjac pieces were separated and the konjac aqueous extract was decanted. A few drops of Konjac extract (stabilizing agent) was added to the synthesized Pb nanoparticles and were kept in a hot air oven at 50 °C for two hours/until it dried. After completion of drying process, their appearance was very fine and powdery in nature. Their structural characterizations were studied and results confirmed the formation of lead nanopowder (with spherical shaped particles). To get rod shaped Pb nanoparticles (to change the spherical shape to rod shape), the same synthesis procedures were adopted and dried in sunlight instead of drying in hot air oven (Model: HASTHAS oven with size 355 mm × 355 mm × 355 mm and max. temp. 300 °C). The X-Ray Diffraction (XRD) analysis of the prepared sample of Pb nanoparticles was done using a X’pert PRO of PANalytical diffractometer, Cu-Kα X-rays of wavelength (λ)=1.5406 Å and data was taken for the 2θ range of 10° to 80° with a step of 0.0170°. The surface morphology was analyzed by using SEM (JEOL Model JSM-6360). The particle size of the Pb nanoparticles was analyzed by Dynamic Light Scattering method using particle size analyzer (Malvern Zetasizer nanosizer). TEM coupled with EDS (Model-ZEISS) was used to analyze the outer surface and inner structures of the particles. Thermal studies of the sample were analysed by Diffrential Scanning Calorimetry (DSC). Concentration of the sample was analyzed by Atomic absorption spectrophotometer (model SHIMADZU-AA 6300). Functional groups were analyzed by SHIMADZU FT-IR spectrometer. The antibacterial activities of Pb nanoparticles were studied against Escherichia coli by Cup and Plate method. Standard Zone of Inhibition (ZOI) was measured and evaluated from this microbiology assay.

Figure 1 Schematic Diagram-Electrolysis of Pb(NO3)2 Solution.
3 Results and Discussion
3.1 XRD studies-peak indexing-Pb nanorods
The XRD pattern of the lead nanorods synthesized by electrolysis method is shown in Figure 2. A number of strong Bragg reflections can be seen which correspond to the (111), (200), (220) (311), (222) and (400) reflections of Face Centered Cubic symmetry (FCC) lead. There is no any spurious diffraction peak found in the sample. The high intense peak for FCC materials is generally (111) reflection; all even or all odd number in each h, k, l; both of these facts are observed in the prepared sample. The intensity of peaks reflects the degree of crystallinity and broadening in diffraction peaks indicates very small size of crystallite [19]. The Pb nanoparticles XRD reflects that the formed lead nanoparticles are crystalline and broad diffraction peaks indicate very small size crystallite. The size of the Pb nanoparticles estimated from Debye– Scherrer formula (Instrumental broadening) is 8 nm. A good agreement between the Experimental diffraction angle [2θ] and Standard diffraction angle [2θ] of specimen is confirming standard of the specimen. 2θ values of all the observed six peaks have been compared with the standard powder diffraction card of Joint Committee on Powder Diffraction Standards (JCPDS), lead file No. 65-2873. The d-spacing values of experimental is also confirming to the standard values. The XRD study confirms/indicates that the resultant particles are (FCC) lead nanopowder.
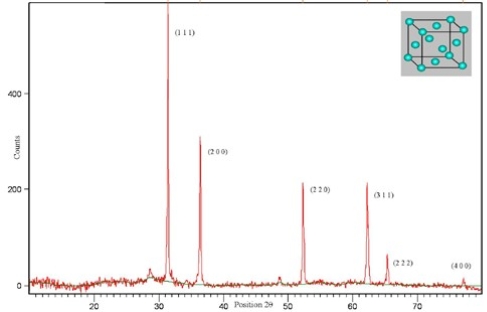
Figure 2 XRD showing Peak Indices & 2θ Positions.
3.2 XRD–lattice constant and particle size calculation
The theoretical value of unit cell edges ‘a’ using atomic radius, average particle size by Debye-Scherrer formula and d-spacing value (the interplanar spacing between the atoms) by using Bragg’s Law are calculated. The results are presented in the Table.1. FCC crystal structure of lead has unit cell edge ‘a’ = 4.9497 Å (For lead r = 0.175 nm). The experimental lattice constant ‘a’ is calculated from the most intense peak (111) of the XRD pattern is 4.938 Å. Both theoretical & experimental lattice constant ‘a’ are in agreement. The unit cell volume calculated from experimental ‘a’ is 120.4074Å3.
3.3 XRD-instrumental broadening
When particle size is less than 100 nm, appreciable broadening in XRD lines will occur because of particle size and strain. The observed line broadening will be used to estimate the average size of the particles. The total broadening of the diffraction peak is due to sample and the instrument. The average particle size D and the strain ε of the experimentally observed broadening of several peaks will be computed simultaneously using least squares method. Ghosh et al. in their report, due to the size effect, the peaks broaden and then widths become larger as the particle size becomes smaller. The broadening of the peak may also occur due to micro strains of the crystal structure arising from defects like dislocation and twinning [20]. Williamson and Hall plot is plotted with sinθ on the x-axis and βcosθ on the y-axis (in radians). A linear fit is got for the data. From the linear fit, particle size and strain are extracted from y-intercept and slope respectively. The extracted particle size is 8 nm and strain is 0.0021.
3.4 XRD–dislocation density and theoretical density
The dislocation density is defined as the length of dislocation lines per unit volume of the crystal [21]. Chen and Hendrickson measured and determined dislocation density and hardness of several silver crystals. They found that crystals with larger dislocation density were harder [22]. It has been shown for different pure face-centered cubic (fcc) metals processed by Equal Channel Angular Pressing (ECAP) that the dislocation density increases while grain size decreases with increasing strain and ultimately these parameters reach saturation values [23]. Above a certain grain size limit (~20 nm) the strength of materials increases with decreasing grain size [24]. The dislocation density (δ) in the sample has been determined using values of FWHM, θ, lattice constant and particle size [25]. The dislocation density can also be calculated with crystallite size value [26]. Both of these methods give approximately same results. The number of unit cell is calculated from crystallite size and cell volume of the sample [27]. From the calculated values of dislocation density and number of unit cells, it is observed that dislocation density is indirectly proportional to particle size and number of unit cell. Dislocation density increases while both particle size and number of unit cell decreases. On the other side, particle size increases while number of unit cell increases. The average dislocation density of lead nanoparticles found to be as 11.1 × 10¹⁴ m-2. The dislocation density of electrolyzed silver nanoparticles 9.2 ×10¹⁴ m-2 has been noted from our earlier report [28]. It is observed that the sample lead nanoparticles harder than electrolyzed silver nanoparticles. Theoretical density of the sample was calculated as per earlier report [29]. The mass of one unit of the chemical formula-Pb (M = 207.8 amu), the number of such chemical units in one unit cell (Z = 4), the volume of the crystalline unit cell as determined by XRD (V = 120.4074Å3) and the Avagadro’s number (N= 6.0221 × 10²³). Using the above values, the theoretical density has been calculated and the value is 11.461 g cm-3. It is agreed well with the reported data.

Table 1 XRD data of lead nanopowder
|
Experimental Lead |
Standard Lead JCPDS: 65-2873 |
||||||
|
2θ of peaks (deg) |
hkl |
FWHM ( β) radians |
Particle Size nm |
d-spacing Å |
Lattice Constant (a) Å |
2θ of peaks (deg) |
d-spacing Å |
|
31.3777 |
(111) |
0.00291 |
49 |
2.85096 |
4.938 |
31.2867 |
2.8574 |
|
36.3611 |
(200) |
0.00321 |
45 |
2.47086 |
4.942 |
36.2828 |
2.4746 |
|
52.3101 |
(220) |
0.00233 |
66 |
1.74894 |
4.947 |
52.2506 |
1.7498 |
|
62.2696 |
(311) |
0.00584 |
28 |
1.49102 |
4.945 |
62.1757 |
1.4922 |
|
65.3477 |
(222) |
0.00584 |
28 |
1.42804 |
4.947 |
65.2722 |
1.4287 |
|
77.0153 |
(400) |
0.00712 |
25 |
1.23719 |
4.949 |
77.0311 |
1.2373 |

3.5 XRD-crystallinity index and morphology index
Sharper XRD peaks are typically indicative of high nanocrystalline nature and larger crystallite materials. From our XRD data, a peak broadening of the nanoparticles is noticed and average particle size, is calculated as 8 nm. TEM result indicates particle size is 10 nm. Crystallinity Index (Icry) is evaluated by comparison of XRD crystallite size and TEM particle size. Xubin et al. in their report, if Icry value is close to 1, then it is assumed that the crystallite size represents monocrystalline whereas a polycrystalline have a much larger crystallinity index [30]. The Icry of the sample is 1.25 which is more than 1.0. It indicates that the sample lead nanoparticles are highly crystalline and fcc phase structure is well-indexed. It is well known that lead powder is widely used in many diverse industries such as scientific, nuclear Oil & gas exploration, anti-corrosive paints, lubricating, and sinter materials, catalysts, explosives industries and also in medical, electrical fields. The use of lead nanopowder is derived from its unique structural, physical and chemical properties, which are reflected by its hardness, surface properties, particle size and morphology. The specific surface area of lead nanopowder (which is important to many of the above mentioned industries) is dependent on the interrelationship of particle morphology and size. Morphology Index (MI) is calculated from FWHM of XRD data, based on our earlier report [31]. Sample lead nanopowder, (MI) range is from 0.50 to 0.75. It is correlated with the particle size (range from 25 to 66 nm) and specific surface area (range from 5.567 to 14.239 m2g-1). It is observed that MI has direct relationship with particle size and an inverse relationship with specific surface area.
3.6 SEM & TEM analyses Pb nanoparticles
The SEM & TEM images have shown the result in Figure.3. The images reveal about the changed shape i.e. rod shaped Pb nanoparticles. The length to diameter ratio from SEM analysis; largest rod is 10 and smallest rod is 5. These ratio < 20 indicates rod shape. An attempt has been made to change the shape of Pb nanoparticles (konjac extract added) from spherical to rod by the influence of sunbeams. Pb nanoparticles strongly absorb light in the visible region due to Surface Plasmon Resonance (SPR). The absorbed light promotes the reactions/effects of the sunlight on Pb nanoparticles, in presence of the amino group of konjac aqueous extract which elongates the nanoparticles in one direction and change their shape from spherical to rod. The result explicates that it is possible to change the shape even after completion of the entire synthesis process. The SEM image in Figure 3(a) shows some spherical particles among the lead nanorods which indicates that these rods have been made up of spherical particles (nucleation growth of particles). The rods have been formed by the binding of spherical particles one by one (one over one) and have been elongated in one direction after binding. Due to this, some up and down structures are in the outer surfaces of the nanorods. The surfaces (textures) are not uniform and not smooth. The synthesized nanorods are in various sizes. The length is varying from 0.5 μm to 12 μm and diameter is 0.1 μm to1.25 μm. It has been considered to calculate, the average size between smallest rod and largest rod, to ascertain the size of nanorod. The length of largest rod is 12 μm and diameter is 1.25 μm. The length of smallest rod is to 0.5 μm and diameter is to 0.1 μm. The average length of rod is to 6.25 μm and diameter is to 0.675 μm. However, SEM analysis does not give real image and it gives real shape only. The above estimated average size of rod is not exact one and it is possible from TEM analysis only. It is apparently that the diameter of the smallest rod is equal to the diameter of spherical particle because the rods have been grown by nucleation growth of smaller particles. It is compared, the diameter of the smallest rod (0.1 μm) from SEM image with particle diameter (10 nm) from TEM image. From this comparison, it is found that the rod diameter 10 times more than TEM particle diameter and the average of the rod has been divided by 10 to assess the real average size of the rod. It is found that the real average length of rod is 625 nm and diameter is 67 nm. This observed value 67 nm corroborates with the particle size-diameter 66 nm from (220) indexed peak of XRD. Also, it is close to the rod diameter 55 nm calculated by particle size analyzer. HRTEM pictures of the synthesized lead nanoparticles have been shown in Figure 3(b). It shows the diameter of the particle is approximately 10 nm. Selected Area Electron Diffraction (SAED) pattern has been taken over 200 micron (diameter) condenser aperture is in Figure 3(c). This indexed SAED pattern confirms FCC structure of the lead. SAED ring pattern is similar to XRD Debye- Scherrer pattern. It provides information about the crystal structure and lattice spacing of the sample; however this information will not be as accurate as from XRD. Figure 3(d) shows the d-spacing 2.83 Å which is well agreement with XRD d-spacing 2.85 Å of (111) indexed, most intense peak at 2θ 31.37.
3.7 Specific surface area
The surface states will play an important role in the nanoparticles, due to their large surface to volume ratio with a decrease in particle size [32]. Specific surface area (SSA) is a material property. It is a derived scientific value that can be used to determine the type and properties of a material. It has a particular importance in case of adsorption, heterogeneous catalysis and reactions on surfaces. SSA is the SA per mass. Jiji et al. has used the values of particle Surface Area, volume and density for the calculation of specific surface area [33]. Yo-Jong et al. has calculated the specific surface area of spherical shaped particle in another method using particle size (Dp) and density ρ of Pb 11.461 g cm-3 [34]. Mathematically, SSA can be calculated using these formulas. Both of these formulas yield same result. S= 4 × 10³/D ρ is the equation for calculation of SSA of rod shaped particles The nanorod length and diameter estimated by SEM analysis has been used to calculate SSA and details are in Table 2. The equations for the calculation of lattice constant, particle size, instrumental broadening, dislocation density, theoretical density, crystallinity index, morphology index and specific surface area are in our earlier report [28], presented in other reports as per the references as well as in the supplementary file.
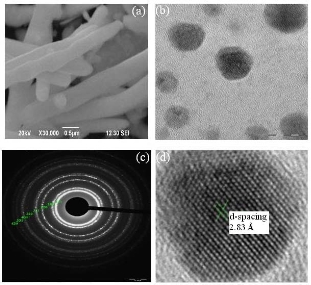
Figure 3 SEM and TEM Images. (a) Pb Nanorods at 30000 magni- fication. (b) HRTEM-Pb Nanospherical. (c) SAED Image-Pb Nanospherical. (d) d-Spacing of Pb Nanospherical
Table 2 (a) Specific surface area of lead nanorods and nanosphericals
|
Particle size (nm) |
Surface Area (nm2) |
Volume (nm3) |
Density (g cm–1 ) |
SSA (m2 g–1) |
S A to volume ratio |
|
|
Length |
Diameter |
|||||
|
625 |
67 |
139693 |
2236540 |
11.461 |
5.4497 |
0.0624 |
|
- |
10 |
314.15 |
523.59 |
11.461 |
52.35 |
0.53 |
3.8 EDS analyses of Pb nanoparticles
The energy value of each peak is matched with X-ray emission wavelength for non-diffractive analysis. The EDS analysis results spectrum of lead is shown in Figure 4(a). It gives distinct elemental signals of lead. The quantitative analysis of lead in weight % abundance is shown Figure 4(b). EDAX analysis is also in well agreement with XRD report and TEM report which indicating that 100% of lead.
3.9 Particle size analyses of Pb nanorods
The particle size analysis report from DLS experiment is further corroborated the rod shape of Pb nanoparticles. Generally, rod shaped particles will not go under Brownian motion or their motion will too slow to measure and this fact was observed from this analysis. As the Pb nanoparticles were in rod shape, there was no Brownian motion and the size distribution by intensity peak was unable to be measured/seen using this DLS analysis. However, this analysis gives average particle size as 55 nm (Z-Average-d.nm is 1.020e4) and Poly Dispersity Index (PDI) as 0.966. The observed rod size (diameter 55 nm) is close to the rod size (diameter 49 nm) most intensity (111) peak of XRD. Konjac aqueous extract (bio-polymer) was added to the synthesized lead nanoparticles as stabilizer. PDI 0.966 is observed from this analysis, which indicates the bio-polymer (konjac aqueous extract).
3.10 DSC analyses of Pb nanorods
The DSC analysis report of the sample is shown in Figure 5. The onset at 326.36 °C is the melting point which is well agreement with bulk lead (327 °C) and lead nanoparticles of earlier report [35]. This confirms that the synthesized sample is lead nanoparticles and its purity. However, the sample have some more peaks other than peak at 327 °C and earlier report has one peak at 327°C which differentiate between both of these analysis. The more peaks which are due to the small layer of Konjac extract over the sample. Very small peak heights and broaden size (width) of these peaks are indicating that Konjac extract covers only a small layer over the sample. The downward movement of the peak in DSC heating curve indicates that the peak is endothermic peak. The Surface Area has been calculated as 6.5624 J g-1 and this positive value indicates that the observed peak is endothermic peak. The melting peak in 327.21°C appears almost as a straight line and increasingly sharper. The straight line and sharpness of melting peak show the purity as well as the smaller size of the synthesized sample.
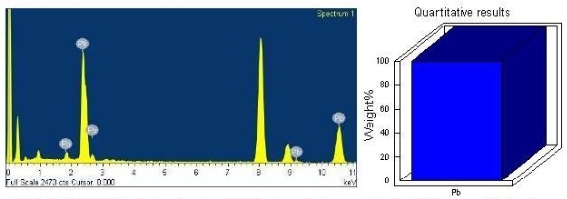
Figure 4 (a). EDAX Spectrum Showing Pb Nanoparticles (b). Elements% Analyses.
3.11 AAS analyses of Pb nanorods
The synthesized lead nanoparticles have been analysed by AAS with optics parameter settings Pb wavelength 283.3 nm and air-acetylene (C2H2) flame type. A calibration curve diagram for Concentration of lead nanoparticles in Parts per Million (ppm) Vs Absorbance has been drawn and a linear fit has been get. It is observed from the Figure.6 that the absorbance is directly proportional to the concentration. The linear fit indicates that the lead nanoparticles have been distributed in proper proportion. Concentration of the sample is 6.9006 ppm (6.9006 mg L-1) and absorbance is 0.1298. Absorbance to concentration ratio of the standard at 4 ppm concentration is 0.01880 and for sample is 0.01880. Both the value is same. Likewise, concentration to absorbance ratio of the standard at 4 ppm concentration is 53.1635 and for sample are 53.1633. It indicates high purity of the sample.
3.12 FT-IR analyses of Pb nanorods
To demonstrate the Konjac extract bound to the surface of the lead nanoparticle, FTIR analyses were performed. The FT-IR spectrum of lead nanorods is shown in Figure7. The absorption peak at 462.86 cm–1 indicates the presence of lead [36]. The observed wave numbers for amines, amides and amino acids indicate the presence of protein [37]. The amino group is one of the key factors in controlling the Pb nanoparicles. The protein material are encapping the metal particles and likely to serve as a capping/stabilizing agent [38]. It is concluded from earlier report NH/C-O groups bind with metals (lead) nanoparticles [39]. Amino acid residues and peptides of proteins have the stronger ability to bind metal and very high affinity to bind with metals. So that protein itself can act as an encapsulating agent and possibly form a layer covering the metal nanoparticles. This layer prevents agglomeration, protects the nanoparticles from agglomerization and thereby stabilizes the medium [40]. The observed bands at wave numbers 3313 cm-1, 3195 cm-1, 2362 cm-1, 1670 cm-1, 1454 cm-1, 1400cm-1, 1334 cm-1 and 1193 cm-1 imply the presence of protein/peptide on the nanoparticle surface. The NH/C-O groups also indicate the presence of biomolecules like nitrates and Carboxylic Acids. C-O-C stretching of wave numbers 1193 cm-1, 808 cm-1 and 750 cm-1 indicates polysaccharides. It is noted here that Glucomannan is a water-soluble polysaccharide (hemicelluloses)-straight- chain polymer, a super absorbent is present in konjac. Oxidations of the synthesized lead nanoparticles are prevented by polysaccharides which are serving as reducing agent. Chealating compounds sediment the lead nanoparticles from residues. Phenolic compounds consisting of a hydroxyl group (OH) bonded directly to an aromatic hydrocarbon group. Presence of OH group (Wave numbers 3313cm-1 and 750 cm-1) along with aromatic compounds indicates phenolic compounds. C-O stretching vibration indicates the secondary alcohol [41]. Presence of alcohol is observed from the wavenumbers 3313 cm-1, 1670 cm-1, 1400 cm-1, 1334 cm-1 and 750 cm-1 due to C-O and O-H groups. It is known that Pb nanoparticles are highly reactive and transfer electron to N2O, O2, etc. The synthesized lead nanoparticles, while on transferring electrons to air, photo-initiators like phenolic compounds and alcohols play some roles to prevent such electron transfer. They absorb light and form hydrated electrons to reduce metal ions to metal. It is noted here that the flying powder of konjac is a polyol (natural polymer) which precipitates soluble heavy metal ions in water. Wave numbers 3313 cm-1, 1670 cm-1, 808 cm-1 and 750 cm-1 indicate the flavanoids which are anti- oxidant substances possess reducing power and can donate electrons. They prevent the oxidation of lead nanoparticles. Proteins in the konjac aqueous extract bind to lead nanoparticles through amine and carboxylates (COO− at the wave number 1400 cm-1 and 1334 cm-1). Water has been used as solvent in the synthesis process. So that the hydroxyl group (OH) is occurred predominantly (Wavenumbers 3313 cm-1, 1400 cm-1, 1334 cm-1 and 750 cm-1) which indicates moisture surroundings of nanoparticles. Br-stretching (Wave numbers 750 cm-1 and 651 cm-1) indicates that mixing of KBr with lead nanoparticles for making pellet while FTIR analyses.
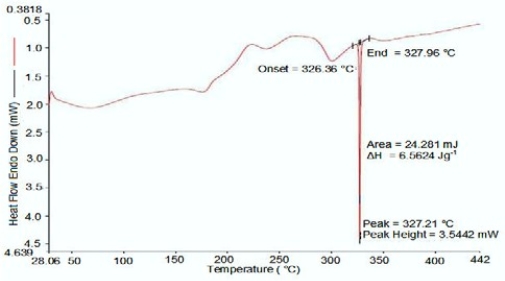
Figure 5 DSC Analysis shows Sharp Peak.

Figure 6 Concentration Vs Absorbance
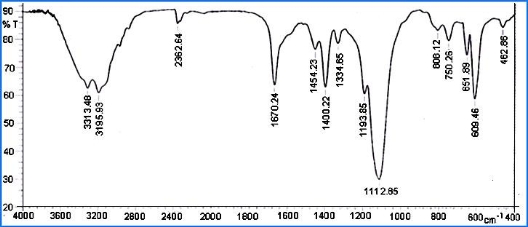
Figure 7 FT-IR Spectrum of Lead Nanorods
3.13 Anti-bacterial studies of spherical Pb nanoparticles
Nanomaterials are the leading requirement of the rapidly developing field of nanomedicine, bionanotechnology. Nanoparticles usually have better or different qualities than the bulk material of the same element and have immense surface area relative to volume. For centuries, People have avoided lead, in their normal life, unlike other metals due its cumulative poison nature. From the preliminary screening anti-bacterial study against E.coli bacteria, it is observed that lead nanoparticles act different from bulk lead, like an inert material and show mild activity when using large quantity but, how this material will act in other biological cells like plants and animals which should be further investigated elaborately. Antibacterial activities of lead nanoparticles were evaluated by cup and plate method. A concentration of 50 mg mL-1 sample solution was used. Zone of Inhibition (ZOI) was measured from this microbiology assay. Figure 8(a) and 8(b) show the result. The sample shows no antimicrobial activity against E. coli when examined using cup and plate method. Mild zone of inhibition of 5 mm was found when the sample of 20 mg was directly kept on the surface of the plate with E. coli. It is a general fact that using a medicine in proper dose is tolerable one but using it in over dosage sometimes leads to death or undesired effects. Likewise, while using optimal quantity of sample in cup and plate test, E. coli tolerates it and does not show ZOI. A mild ZOI is made while dumping with large quantity of sample (20 mg) on E. coli. In a solid material, the surface-area-to-volume ratio (SA:V) or Specific Surface Area (SSA) is an important factor for the reactivity that is, the rate at which the chemical reaction will proceed. Materials with large SA: V (very small diameter) reacts at much faster rates than monolithic materials, because more surfaces are available to react. For studying, changes in Specific Surface Area (SSA) of nanoparticles and its effects on antibacterial activities nanoparticles, we have compared SSA of lead nanoparticles and silver Nanoparticles of our earlier study [28]. The details are presented in Table 3. Our earlier study suggests that that increased SSA results enhance the antibacterial activities of Silver nanoparticles. From this comparative study, though lead nanoparticles have SSA more than silver nanoparticles, the antibacterial activities of lead nanoparticles is less than Silver nanoparticles. It indicates that the reactions of nanoparticles with bacterial cell wall/fluid are also the determining factor of antibacterial activities. We have made an attempt to study the SSA of bacteria and its reactivity to antibacterial activities of nanoparticles. For this study, we have compared SSA of E. coli with nanoparticles of lead and silver. E. coli details (Cell length: 2 × 10⁻⁶ m, diameter: 0.8 × 10⁻⁶ m, total volume: 1 × 10-18 m3, surface area: 6 × 10-12 m2, wet weight: 1 × 10-12 g, dry weight: 3.0 × 10⁻¹³ g) has been extracted from The CyberCell Database-CCDB and SSA calculated accordingly [42]. Bacteria, viruses and fungi all depend on an enzyme to metabolize oxygen to live. Silver interferes with the effectiveness of the enzyme and disables the uptake of oxygen, thereby killing the microbes but in the case of lead, it does not interfere with the enzyme or showing less interference at high concentration. It is observed from our earlier study of silver nanoparticles that SSA of both nanoparticles and bacteria are playing major roles in their inter reactions and influencing and affecting factors of ZOI. The present study reveals that apart from the SSA of them, the interferences, bio-chemical reactions and affinity of metal nanoparticles with cell wall/fluid of microbes are also one of the main factors. Exposure of bacteria cell to the environment and rate of exchange of substances that is in contact with its surroundings depends on the SSA of bacteria. E. coli shows same exposure to the environment/surroundings in which lead and silver nanoparticles are existing. The SSA of lead nanoparticles is more than silver nanoparticles. It means lead nanoparticles have more reactive sites than silver nanoparticles. Also, due to its lesser size, it can easily enter into the E.coi cell more than silver nanoparticles while E. coli exchanging the surroundings substances. These factors are supporting for the reactions between lead nanoparticles and E. coli but there is no bio-chemical reactions between them or very less reactions while on using more concentration of sample and it is opposite, in the case of silver nanoparticles. The more bio-chemical reactions/interferences between silver nanoparticles and E.coli produce unfavourable surroundings results in more damages to bacteria and increased Zone of Inhibition.
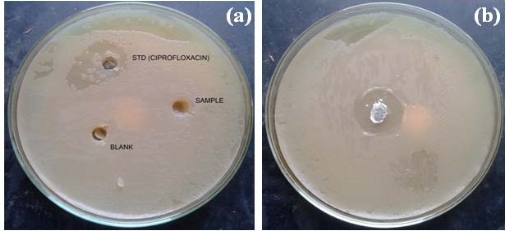
Figure 8 Zone of Inhibition Against E. coli Bacteria. (a) No Zone. (b) A mild zone:5 mm.
Table 3 Comparision of Surface Area to Volume Ratio and antibacterial activities of Lead Nanoparticles on E. coli (Gram Negative bacteria)
|
Nano particles |
Particle Size (nm) |
Surface Area (nm2) |
Volume (nm3) |
Surface Area to Volume Ratio |
SSA (m2 g−1) |
Diameter Inhibition Zone (mm) |
E.coli Bacteria SSA (m2 g−1) |
|
Lead |
10 |
314.15 |
523.59 |
0.53 |
52.35 |
5 |
20.09 |
|
Silver |
24 |
1809 |
7235 |
0.25 |
24 |
12 |
4 Conclusions
We have synthesized rod and spherical shaped Pb nanopowder by electrolysis using a bioactive compound-konjac aqueous extract. The synthesized lead powder has potential applications and can be used in many diverse industries. This synthesis method is a unique, novel and double-step procedure with good reproducibility. XRD confirms that the prepared nanoparticles are lead which agrees with EDS analysis. The approximate size calculated from XRD is 8 nm which corroborates with the size 10 nm assessed from TEM. The size 55 nm is observed from Particle Size Analyzer. The spherical shape is observed from TEM. The result of SEM gives a conclusion about the rod shape of the synthesized nanoparticles. The melting point observed from DSC is well agreement with the lead nanoparticles of earlier report. AAS result concludes that absorbance of the sample is equal to the absorbance of the standard lead solution. FTIR confirms binding of biomolecules with lead nanoparticles. Anti-bacterial assay of lead nanoparticles against E. coli shows that lead nanoparticles act like an inert material and show mild activity when using large quantity. An attempt has been made to find the effects of the sunlight on nanomaterials which concludes that the sunlight can be utilized for dual function i.e. as a dryer for the synthesized nanomaterials and as a morphological changer. It also explicates that it is possible to change the shape of Pb nanoparticles (konjac extract added) from spherical to rod by the influence of sunbeams, even after completion of the entire synthesis process.
Acknowledgements
The authors express their immense thanks to Central Electrochemical Research Institute, (CECRI, Karaikudi), Karunya University (Coimbatore), Indra Gandhi Centre for Atomic Research (IGCAR, Kalpakkam), The Standaard Fireworks Rajaratnam College for Women (Sivakasi), Ayya Nadar Janaki Ammal College (ANJAC, Sivakasi) for providing laboratory instruments to analyze the samples, Dr.S.Amirthapandian of IGCAR for his assistances and valuable guidances in TEM analyses and to Dr.M.Palanivelu, of Arulmigu Kalasalingam College of Pharmacy (Kalasalingam University, Krishnankoil, India) for assistances in anti-bacterial studies. They also acknowledge assistances and encouragements of staff & management of PACR Polytechnic College, Rajapalayam, India and ANJAC (Sivakasi, India).
Appendix A. Supplementary Data
Supplementary data associated with this article can be found in the online version at the link at: http://nanobe.org/index.php?journal=nbe& page=rt&op=suppFiles&path[]=218&path[]=0
References
Copyright:(c) T. Theivasanthi and M. Alagar. This is an open-access article distributed under the terms of the Creative Commons Attribution License, which permits unrestricted use, distribution, and reproduction in any medium, provided the original author and source are credited.

|
Nano Biomedicine and Engineering. Copyright © Shanghai Jiao Tong University Press |
 |