Research Article
Preparation and Characterization of Naproxen Loaded Niosomes by Ether Injection Method
Abbaraju Krishna Sailaja *, Marneni Shreya
Department of Pharmaceutics, RBVRR Women’s College of Pharmacy, Osmania University, Hyderabad.
* Corresponding author. E-mail: shailaja1234@rediffmail.com
Received: Feb. 23, 2018; Accepted: Jun. 4, 2018; Published: Jun. 12, 2018
Citation: Abbaraju Krishna Sailaja, Marneni Shreya, Preparation and Characterization of Naproxen Loaded Niosomes by Ether Injection Method. Nano Biomed. Eng., 2018, 10(2): 174-180.
DOI: 10.5101/nbe.v10i2.p174-180.
Abstract
The objective of the present research was to prepare and characterize naproxen loaded niosomes by ether injection method. A total of sixteen formulations were prepared by ether injection method by varying the type and concentration of surfactant. All the formulations were evaluated for drug content, entrapment efficiency, loading capacity and drug release profiles. Based on evaluation parameters, formulation E14 prepared by ether injection method showed entrapment efficiency of 95.86%, drug content of 94.9% , zeta potential value of -31.9 mV, suggesting its higher stability and particle diameter of about 393.9 nm. In-vitro release studies also showed that of all the formulations, E14 released about 88.9% by the end of 12 hours, showing a sustained release pattern with high amount of drug release when compared to the other formulations. Drug release kinetic studies of optimized formulation (E14) followed zero order release with R2 value of 0.987 and showed super case 2 transport mechanism. Based on the results, tween 80 with 1:1 ratio of drug to surfactant was considered as the best formulation for the preparation of naproxen loaded niosomes by ether injection method.
Keywords: Zeta potential; SPAN 60; Optical microscopy; Entrapment efficiency
Introduction
Drug targeting is a phenomenon in which the distribution of drug in the body in such a manner that the major fraction of the drug interacts exclusively with the target tissue at a cellular or subcellular level. The objective of drug targeting is to achieve a desired pharmacological response at a selected site without undesirable interactions at other sites [1, 2]. This is especially important in cancer chemotherapy and enzyme replacement treatment. Drug targeting is the delivery of drugs to receptors or organs or any other specific part of the body to which one wishes to deliver the drug exclusively. The second approach utilizes carriers such as liposomes, niosomes, microspheres, nanoparticles, antibodies, cellular carriers (erythrocytes and lymphocytes) and macromolecules to direct the drug to its site of action [3, 4]. Recent advancements have led to the development of several novel drug delivery systems that could revolutionize the method of medication and provide a number of therapeutic benefits. The goal of any drug delivery system is to provide a therapeutic amount of drug to the proper site in the body to achieve promptly, and then maintain, the desired drug constant. The ideal drug delivery system delivers drug at a rate dictated by the need of the body over the period of treatment and it channels the active entity solely to the site of action. At present, no available drug delivery systems can achieve all these goals. The targeted drug delivery system achieves the site-specific delivery but is unable to control the release kinetics of drug in predictable manner [5, 6]. Paul Ehrlich in 1906, initiated the era of development for targeted delivery when he investigated a drug delivery mechanism that would target drugs directly to diseased cells. A number of carriers were utilised to carry drug at the target organ / tissue which included immunoglobulins, serum proteins, synthetic polymers, lipid vesicles (liposomes), microspheres, erythrocytes, reverse micelles, niosomes, pharmacosomes, etc. Amongst the various carriers, few drug carriers reached the stage of clinical trials where phospholipid vesicle showed strong potential for effective drug delivery to the site of action. These carriers (niosomes) are biologically inert in nature, devoid of any antigenic, pyrogenic or allergic reactions and their components can be utilised as the component of biological membrane. Drugs incorporated in liposomes, niosomes were not activated under physiological conditions and did not cause unfavourable side effects as well [7, 8]. Naproxen is a non-steroidal anti-inflammatory agent with potent analgesic used in the treatment of rheumatoid arthritis and ankylosing spondylitis to relieve pains and inflammation. It mainly acts by inhibiting cox-1 and cox-2 receptors. Cyclo-oxygenase is involved in the production of various chemicals in the body, some of which are known as prostaglandins. Prostaglandin is produced in response to injuries or certain diseases; by inhibiting cox-1 receptors, it causes severe gastric bleeding and peptic ulcers, while by inhibiting cox-2 receptors, it causes severe cardiovascular diseases [9, 10]. The delayed release or extended release tablets are slower acting forms of naproxen that are used only for chronic conditions such as arthritis or ankylosing spondylitis. But in the long term use of naproxen in auto immune diseases, it may cause gastric bleeding and can increase the risk of fatal heart attack or stroke. To overcome these side effects of naproxen, there is a need to employ novel drug delivery system like niosomes [11, 12].
Experimental
Materials
Naproxen was obtained from SD Fine Chemicals. Span 80, Tween 80, Tween 60 and Span 60 were purchased from SD Fine Chemicals.
Methods
Weighed amount of non-ionic surfactant (Span 80, Tween 80, Tween 60 and Span 60) was taken along with cholesterol and dissolved in 6 mL of diethyl ether which was mixed with 2 mL of methanol previously containing weighed quantity of drug. Then resulting solution was slowly injected using micro syringe at the rate of 1 mL/min into 10 mL 7.4 pH phosphate buffer. Then, the solution was stirred continuously with magnetic stirrer and the temperature was maintained at 60-65 ℃. The difference in temperature between the phases caused vaporization, resulting in the formation of niosomes [13, 14].
Characterisation and evaluation of niosomes prepared by ether injection method
The characterisation and evaluation results of niosomes prepared by ether injection method are listed in Table 1.
Table 1 Characterisation and evaluation of niosomes prepared by ether injection method
|
Formulation code |
Surfactant |
Drug : surfactant ratio |
Drug (mg) |
|
E1 |
Span 60 |
1 : 0.5 |
50 |
|
E2 |
Span 60 |
1 : 1 |
50 |
|
E3 |
Span 60 |
1 : 2 |
50 |
|
E4 |
Span 60 |
1 : 3 |
50 |
|
E5 |
Tween 60 |
1 : 0.5 |
50 |
|
E6 |
Tween 60 |
1 : 1 |
50 |
|
E7 |
Tween 60 |
1 : 2 |
50 |
|
E8 |
Tween 60 |
1 : 3 |
50 |
|
E9 |
Span 80 |
1 : 0.5 |
50 |
|
E10 |
Span 80 |
1 : 1 |
50 |
|
E11 |
Span 80 |
1 : 2 |
50 |
|
E12 |
Span 80 |
1 : 3 |
50 |
|
E13 |
Tween 80 |
1 : 0.5 |
50 |
|
E14 |
Tween 80 |
1 : 1 |
50 |
|
E15 |
Tween 80 |
1 : 2 |
50 |
|
E16 |
Tween 80 |
1 : 3 |
50 |
Characterization and evaluation of naproxen loaded niosomes prepared by ether injection method
Microscopic evaluation of niosomes
Morphology was determined for all the sixteen formulations using projection microscope with 10× magnification. The photo micrographic picture of the preparation was obtained from the microscope by using a digital SLR camera [15, 16]; the image of multi and unilamellar vesicles of E14 formulation is shown in Fig. 1.
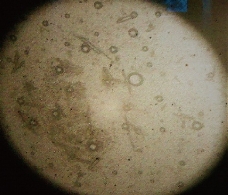
Fig. 1 Photo microscopic image of multi and unilamellar vesicles of E14 formulation of naproxen loaded niosomes prepared by ether injection method.
Mean vesicular diameter
The mean vesicular diameter of the optimized formulation was evaluated by using Malvern instrument. The mean vesicular diameter of the optimized formulation E14 containing the 1 : 1 ratio of drug : surfactant concentration was showing the minimum mean vesicular diameter of 393.9 nm.
Zeta potential
The optimized formulation was characterized for zeta potential value in order to reveal the stability of the formulation [17]. The zeta potential value for the optimized formulation was found to be -31.9 mV. The zeta potential of the optimized formulation E14 containing the 1 : 1 ratio of drug : surfactant concentration was showing the highest zeta potential of -31.9 mV. A higher zeta potential was an indicator of a stable colloidal system.
Drug content
The drug content for all the sixteen formulations were evaluated by using UV spectroscopy at 271 nm [18]. The percentage of drug content of each formulation was found to be E1 (89%), E2 (88.4%), E3 (87.6%), E4 (86.6%), E5 (93.62%), E6 (92.91%), E7 (91.9%), E8 (89%), E9 (91.1%), E10 (91.16%), E11 (87.08%), E12 (87%), E13 (90.58%), E14 (94.9%), E15 (89.3%) and E16 (92.18%), respectively (Fig. 2). Among all the formulations, the niosomes prepared by Tween 80 (E14) at 1:1 ratio was superior with highest drug content of 94.9%.
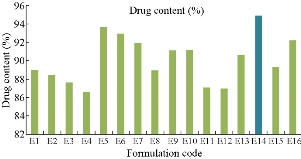
Fig. 2 Drug content profile of naproxen loaded niosomes for all sixteen formulations.
Entrapment efficiency:
The entrapment efficiency for all the sixteen formulations was evaluated using cooling ultracentrifuge (Eltek, Mumbai, India). The percentage of entrapment efficiency of all the formulations were found to be E1: 85.2%, E2: 88.4%, E3: 88.12%, E4: 87%, E5: 85.5%, E6: 93.89%, E7: 89.3%, E8: 87.8%, E9: 95.8%, E10: 91.7%, E11: 91.25%, E12: 85.5%, E13: 92.2%, E14: 95.86%, E15: 90.3% and E16: 87.52%, respectively (Fig. 3). Among all the formulations the niosomes prepared by Tween 80 (E14) at 1 : 1 ratio was superior with highest entrapment efficiency of 95.86%.
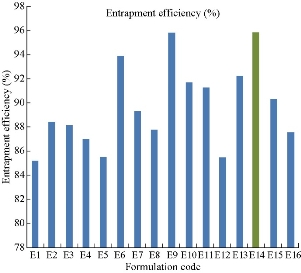
Fig 3 Entrapment efficiency profile of naproxen loaded niosomes for all sixteen formulations.
Comparison studies of naproxen loaded niosomes with Spans and Tweens by ether injection method
According to Fig. 4 and Table 2, the drug content values revealed that formulation trials of Span 80 were having higher amount of drug content values when compared with those of Span 60 and all the Spans containing formulations. E9 Formulation having Span 80 wih an ratio of 1 : 0.5 showed the best drug content value of 91.9%. From Fig. 5 and Table 3, it was observed that the entrapment efficiency values of Span 60 and Span 80 results revealed that formulation trials of Span 80 were having higher amount of entrapment efficiency values when compared with Span 60 and all the Spans containing formulations. Span 80 of formulation E9 with the ratio of 1 : 0.5 showed the best entrapment efficiency value of 95.8%. Fig. 6 shows the comparison of Tweens containing formulations. Tween 80 containing formulation E14 at the ratio of 1 : 1 exhibited the best drug content value of 94.9%; it had higher amount of drug content than Tween 60 containing formulations. Hence, by the above comparison studies of Span and Tween, one could say that Tween containing formulations produced more drug content. According to Fig. 7, Tweens containing formulation E14 at the ratio of 1 : 1 showed best entrapment efficiency value of 95.86%, having higher amount of entrapment efficiency than Tween 60 containing formulations. Hence, by the above comparison studies of Span and Tween, one could say that Tween containing formulations produced more entrapment efficiency.
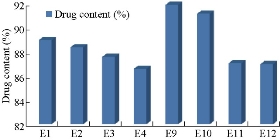
Fig. 4 Percentage of drug content of naproxen loaded niosomes by ether injection method with Span series.
Table 2 Comparison studies of Spans by ether injection method
|
Span grade |
% Drug content |
Entrapment efficiency |
|
Span 60 (E1) |
89 |
85.2 |
|
Span 60 (E2) |
88.4 |
88.4 |
|
Span 60 (E3) |
87.6 |
88.12 |
|
Span 60 (E4) |
86.6 |
87 |
|
Span 80 (E9) |
91.9 |
95.8 |
|
Span 80 (E10) |
91.16 |
91.7 |
|
Span 80 (E11) |
87.08 |
91.25 |
|
Span 80 (E12) |
87 |
85.5 |
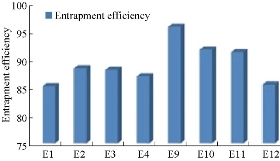
Fig. 5 Percentage of entrapment efficiency of naproxen loaded niosomes by ether injection method with Span series.
Table 3 Comparison studies of Tweens by ether injection method
|
Tween grade |
% Drug content |
Entrapment efficiency |
|
Tween 60 (E5) |
93.62 |
85.5 |
|
Tween 60 (E6) |
92.91 |
93.89 |
|
Tween 60 (E7) |
91.9 |
89.3 |
|
Tween 60 (E8) |
89 |
87.8 |
|
Tween 80 (E13) |
90.58 |
92.2 |
|
Tween 80 (E14) |
94.9 |
95.86 |
|
Tween 80 (E15) |
89.3 |
90.3 |
|
Tween 80 (E16) |
92.18 |
87.52 |
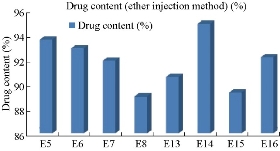
Fig. 6 Percentage of drug content of naproxen loaded niosomes by ether injection method with Tween series.
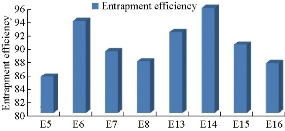
Fig. 7 Entrapment efficiency of naproxen loaded niosomes by ether injection method with Tween series.
In-vitro drug release studies
The in-vitro drug release studies for all the sixteen formulations were conducted using Franz diffusion cell for a time period of 12 hours. The percentage of drug release of each formulation by the end of 12 hours was found to be E1: 60.8 ± 0.74%, E2: 57.14 ± 0.75%, E3: 59.87 ± 0.62%, E4: 62.56 ± 0.40%, E5: 56.67 ± 0.70%, E6: 55.58 ± 0.41%, E7: 60.11 ± 0.98%, E8: 58.45 ± 0.42%, E9: 66.9 ± 0.42%, E10: 58.89 ± 0.42%, E11: 61.2 ± 0.86%, E12: 65.54 ± 0.36%, E13: 62.2 ± 0.55%, E14: 88.9 ± 0.71%, E15: 57.81 ± 0.05% and E16: 60.15 ± 0.99%, respectively (Fig. 9). Among all the formulations, niosomes prepared by Tween 80 (E14) at 1 : 1 ratio was showing drug release of 88.9%, indicating that by comparison of both surfactants, Tweens were showing the highest drug release than Spans in the ether injection method. The in-vitro dissolution data was depicted in Fig. 8 and 9.
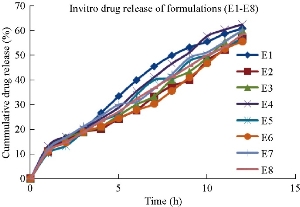
Fig. 8 In-vitro drug release profile of naproxen loaded niosomal formulations (E1-E8).
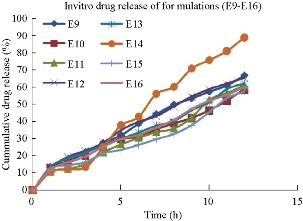
Fig. 9 In-vitro drug release profile of naproxen loaded niosomal formulations (E9-E16).
Comparison studies of naproxen loaded niosomes formulations prepared using Spans and Tweens by ether injection method of dissolution studies
Formulations prepared by using Span 60 with different ratios showed drug release pattern in a time period of 12 hours as described above, i.e. formulation E1 containing Span 60 (1: 0.5) showed drug release of 60.8 ± 0.74%; formulation E2 containing Span 60 (1 : 1) showed drug release of 57.14 ± 0.75%; formulation E3 containing Span 60 (1 : 2) showed drug release of 59.87 ± 0.62%; formulation E4 containing Span 60 (1 : 3) showed drug release of 62.56 ± 0.40%. Now when we compared Tween formulations, formulation E5 containing Tween 60 (1 : 0.5) showed drug release of 56.67 ± 0.70%; formulation E6 containing Tween 60 (1 : 1) showed drug release of 55.58%; formulation E7 containing Tween 60 (1 : 2) showed drug release of 60.11 ± 0.98%; formulation E8 containing Tween 60 (1 : 3) showed drug release of 58.45 ± 0.42%. When we compared the results obtained from Span 60 and Tween 60 formulations, Span 60 containing formulations showed better drug release than Tween 60 containing formulations. Formulations prepared by using Span 80 with different ratios showed drug release pattern as described above, i.e. formulation E9 containing Span 80 (1 : 0.5) showed drug release of 66.9 ± 0.42%; formulation E10 containing Span 80 (1 : 1) showed drug release of 58.89 ± 0.42%; formulation E11 containing Span 80 (1 : 2) showed drug release of 61.2 ± 0.86%; formulation E12 containing Span 80 (1 : 3) showed drug release of 65.54 ± 0.36%. Now when we compared Tween 80 containing formulations, formulation E13 containing Tween 80 (1 : 0.5) showed drug release of 62.2%; formulation E14 containing Tween 80 (1 : 1) showed drug release of 88.9 ± 0.71%; formulation E15 containing Tween 80 (1 : 2) showed drug release of 57.81 ± 0.05%; formulation E16 containing Tween 80 (1 : 3) showed drug release of 60.15 ± 0.99%. When we compared the results obtained from Span 80 and Tween 80 formulations, Tween 80 containing formulations showed better drug release than Span 80 containing formulations. Finally, of all the formulations, Tween 80 containing formulation E14 at 1 : 1 ratio showed best drug release pattern with sustained release of 88.9 ± 0.71% by the end of 12 hours, and was selected as the optimized formulation for ether injection method.
Kinetics of drug release
Different plots (zero order, first order, Higuchi and Korsmeyer-Peppas plots) were drawn for the optimized formulation (E14), in order to show the release kinetics of the drug. According to the kinetic plots, the optimized formulation E14 was following the zero order release with super case II transport mechanism (Fig. 10; Table 4).
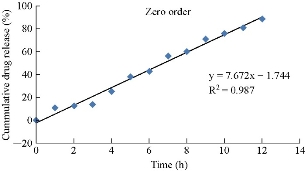
Fig. 10 Zero order release data for optimized formulation E14.
Table 4 Kinetic release data for optimized formulation E14
|
Formulation |
Zero order (R²) |
First order (R²) |
Higuchi plot (R²) |
Peppas plot (n) |
|
E14 |
0.987 |
0.926 |
0.895 |
0.985 |
Results and Discussion
The mean vesicular diameter of the optimized formulation E14 containing the 1 : 1 ratio of drug : surfactant concentration showed the minimum mean vesicular diameter of 393.9 nm. The zeta potential of the optimized formulation E14 containing the 1 : 1 ratio of drug : surfactant concentration showed the highest zeta potential of -31.9 mV. A higher zeta potential is an indicative of a stable colloidal system [14]. By observing the drug content values of Span 60 and Span 80 results in Fig. 4 and 6, we could say that formulation trials of Span 80 had higher amount of drug content values when compared with those of Span 60 and all the Spans containing formulation E9 at the ratio of 1 : 0.5; Span 80 showed the best drug content value of 91.9%. Fig. 5 and 7 showed the entrapment efficiency values of Span 60 and Span 80, the results revealed that formulation trials of Span 80 had higher values of entrapment efficiency when compared to Span 60 and all the Spans containing formulation E9; Span 80 showed the best entrapment efficiency value as of 95.8% [16]. By comparison of the Tweens containing formulations, Tween 80 containing formulation E14 at the ratio of 1 : 1 showed the best drug content value of 94.9%, presenting a higher amount of drug content than Tween 60 containing formulations. Hence, by the above comparison studies of Span and Tween, we could say that Tween containing formulations produced more drug content. By comparison studies, E14 at the ratio of 1 : 1 showed the best entrapment efficiency value as of 95.86%. Tween 80 had higher value of entrapment efficiency than Tween 60 containing formulations. Hence, Tween containing formulations produced higher entrapment efficiency. Drug release patterns of formulations prepared by using Span 60 at different ratios were described. By comparing the results obtained from Span 60 and Tween 60 formulations, we found that Span 60 containing formulations showed better drug release than Tween 60 containing formulations. By comparing the results obtained from Span 80 and Tween 80 formulations, Tween 80 containing formulations was found to show better drug release than Span 80 containing formulations. Finally, of all the formulations, E14 at the ratio of 1 : 1 showed the best drug release pattern with sustained release of 88.9 ± 0.71% by the end of 12 hours, and was thus selected as the optimized formulation for ether injection method. Out of the sixteen formulations, Tween 80 containing E14 at 1 : 1 ratio was found to be the best formulation because of its good entrapment efficiency (95.86%), drug content (94.9%) and sustained drug release (88.9%) in the time period of 12 hours.
Conclusions
Naproxen is an anti-inflammatory agent with analgesic and antipyretic properties. Both the acid and its sodium salt are used in the treatment of rheumatoid arthritis and other rheumatic or musculoskeletal disorders, dysmenorrhea, and acute gout. And the terminal elimination half-life is approximately 15 hours. A total of sixteen formulations were prepared by ether injection method. Based on evaluation parameters, formulation E14 prepared by ether injection method showed entrapment efficiency of 95.86%, drug content of 94.9% , and zeta potential value of -31.9 mV, which suggested it was more stable, and its particle diameter was about 393.9 nm. In-vitro release studies also showed that of all the formulations, E14 released about 88.9% by the end of 12 hours, showing sustained release pattern with high amount of drug release when compared to all the other formulations. Drug release kinetic studies of the optimized formulation E14 followed zero order release with R2 value of 0.987 and showed super case II transport mechanism.
Conflict of Interests
The authors declare that no competing interest exists.
References
1. F.P. Bonina, L. Montenegro, and F. Guerrera, Naproxen 1-Alkylazacycloalkan-2-one esters as dermal prodrugs: in vitro evaluation. International Journal of Pharmaceutics, 1993, 100(1-3): 99-105.
2. R. Valjakka-Koskela, M. Kirjavainen, J. Mönkkönen, et al., Enhancement of percutaneous absorption of naproxen by phospholipids. International Journal of Pharmaceutics, 1998, 175: 225-230.
3. T. Degim, A. Uslu, J. Hadgraft, et al., The effects of Azone and capsaicin on the permeation of naproxen through human skin. International Journal of Pharmaceutics, 1999, 179: 21-25.
4. V. Gupta, A. Dwivedi, N. Trivedi, et al., Formulation and evaluation of naproxen gel containing Tulsi oil as penetration enhancer. International Journal of Pharmaceutical and Clinical Research, 2009, 1(3): 153-155.
5. M.S. Harsoliya, V.M. Patel, M. Madosiya, et al., Developed and evaluated transdermal drug delivery system of naproxen drug with chitosan for treatment of arthritis. International Journal of Pharmaceutical & Biological Archives, 2012, 3(2): 363-367.
6. E. Moghimipour, A. Salimi, S. Eftekhari, et al., Design and characterization of microemulsion systems for naproxen. Adv Pharm Bull., 2013, 3(1): 63-71.
7. N. Mishra, V. Srivastava, A. Kaushik, et al., Formulation and in-vitro evaluation of niosomes of aceclofenac. Journal of Scientific and Innovative Research, 2014, 3(3): 337-341.
8. K. Kar, P. Sudheer, Formulation and evaluation of niosomal drug delivery system of ketoprofen. RGUHS J Pharm Sci, 2015, 5(4).
9. E. Moghimipour, M. Tafaghodi, A. Balouchi, et al., formulation and in vitro evaluation of topical liposomal gel of triamcinolone acetonide. RJPBCS, 2013, 4(1): 101-107.
10. D.G. Umalkar, K.S. Rajesh, Formulation and evaluation of liposomal gel for treatment of psoriasis. International Journal of Pharma and Bio Sciences, 2013, 4(4), 22-32.
11. P.H. Jaiswal, N.A. Gujarathi, B.R. Rane, et al., Formulation of niosomal gel of diclofenac sodium and its in-vitro characterization. IJPPR, 2016, 6(4): 585-600.
12. V. Gadekar, M. Bhowmick, G.K. Pandey, et al., Formulation and evaluation of naproxen proniosomal gel for the treatment of inflammatory and degenerative disorders of the musculoskeletal system. Journal of Drug Delivery & Therapeutics, 2013, 3(6): 36-41.
13. N. Shah, M.K. Gupta, N.K. Jain, et al., Formulation, optimization and characterization of naproxen noisome. Current Research in Biological and Pharmaceutical Sciences, 2015, 4(5): 10-15.
14. M. Rangasamy, B. Ayyasamy, S. Raju, et al., Formulation and in vitro evaluation of niosome encapsulated acyclovir. Journal of Pharmacy Research, 2008, 1(2): 163-166.
15. S.A. Mujeeb, A.K. Sailaja, Formulation of ibuprofen loaded niosomal gel by different techniques for treating rheumatoid arthritis. Journal of Bionanoscience, 2017, 11(3): 1-8.
16. S.S. Sultana, A.K. Sailaja, Formulation and evaluation of diclofenac sodium transferosomes using different surfactants by thin film hydration method. Der Pharmacia Lettre, 2015, 7(11): 43-53.
17. K. Srikanth. V. Rama Mohan Gupta, N. Devanna, Formulation and evaluation of nystatin loaded niosomes. IJPSR, 2013, 4(5): 2015-2020.
18. L. Rahman, Arisanti, and M.A. Manggau, Niosomal transdermal gel formulation of curcumin having anti-inflammatory effect in experimental rat models. Journal of Chemical and Pharmaceutical Research, 2015, 7(9): 843-849.
19. A.K. Sailaja, N. Begum, Formulation and evaluation of cox-2 inhibitor (etoricoxib) loaded ethyl cellulose nanoparticles for topical drug delivery. Nano Biomedicine and Engineering, 2018, 10(1): 1-9.
20. A.K. Sailaja, A comparative study of aspirin loaded bovine serum albumin nanoparticles prepared by desolvation technique using various desolvating agents. Nano Biomedicine and Engineering, 2017, 9(2): 143-151.
21. A.K. Sailaja, A. Sarita, Preparation and characterization of Aspirin loaded ethyl cellulose nanoparticles by solvent evaporation technique. World Journal of pharmacy and Pharmaceutical Sciences, 2014, 3(6): 1781-1793.
Copyright© Abbaraju Krishna Sailaja, Marneni Shreya. This is an open-access article distributed under the terms of the Creative Commons Attribution License, which permits unrestricted use, distribution, and reproduction in any medium, provided the original author and source are credited.